




Bitcoin price fell below $78,000 on Sept. 10 as hotter U.S. producer inflation, ETF outflows and weakening technical indicators weighed on demand ahead of the Federal Reserve’s September meeting.
Summary
- Bitcoin price fell 1.31% to $77,278 after reaching an intraday low of $76,676.
- Price broke below the daily Bollinger Band midpoint and 4-hour Supertrend support.
- 4-hour CMF dropped to -0.06, indicating that capital flows favored sellers.
- Liquidation clusters near $79,500–$80,000 could become an upside price magnet.
Bitcoin price falls toward its lower Bollinger Band
According to data from crypto.news, Bitcoin (BTC) price was trading near $77,278 at the time of writing, down 1.31% on the daily chart. The asset opened the session at $78,306 before falling as low as $76,676, placing it near the bottom of its recent trading range.
The wider crypto market also declined 2.01% over 24 hours to $2.65 trillion. Ether traded near $2,420, while XRP and Solana changed hands around $1.36 and $99.31, respectively.
U.S. producer inflation contributed to the risk reduction. August headline producer price inflation reached 5.4%, slightly above the 5.3% forecast, while core PPI climbed to 4.6%, its highest reading since June 2026.
The hotter figures added to concerns that the Federal Reserve could raise rates at its Sept. 15–16 meeting. Higher rates can place pressure on crypto and other risk assets by raising yields on cash and government debt.
Bitcoin’s daily chart shows that the latest retreat followed several failed attempts to sustain gains above $80,000. Price also formed lower highs after its early September peak above $82,000, showing that buyers lost momentum near the upper end of the range.
Daily indicators point to $76,392 support
Bitcoin has dropped below the daily Bollinger Band midpoint at $78,650. Losing that level shifts attention to the lower band at approximately $76,392, which sits just below the Sept. 10 intraday low.
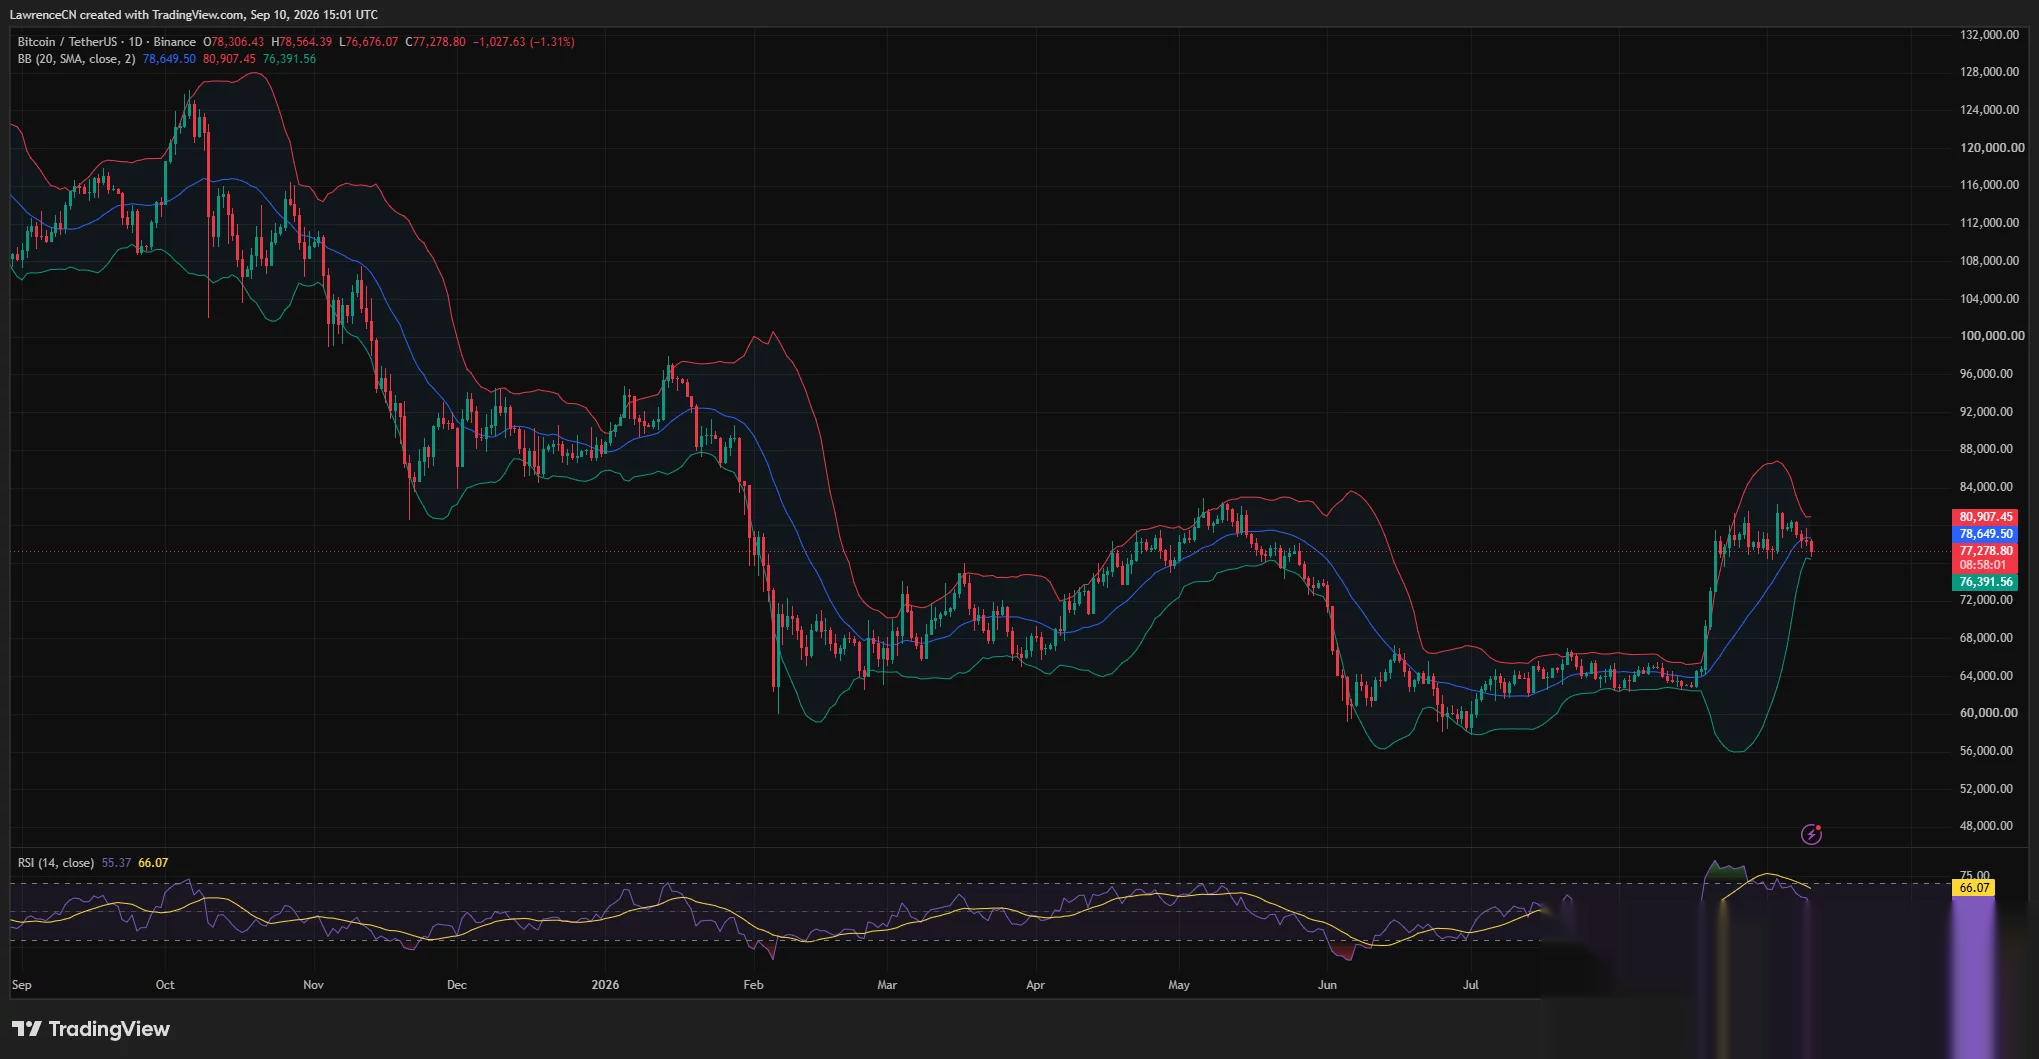
The Bollinger Bands place the upper boundary near $80,907. Bitcoin would need to recover the midpoint before mounting another attempt at that upper resistance.
Daily relative strength has also started to cool. The RSI stood at 55.37, down from its moving average of 66.07. The indicator remains above the neutral 50 mark, but the decline shows that bullish momentum has weakened since the early September rally.
A daily close below $76,392 would confirm a break under the lower Bollinger Band and expose the psychological $76,000 level. If buyers fail to defend that area, the next visible support zones are near $75,000 and $74,000.
Holding the lower band would keep Bitcoin inside its volatility range. A rebound would first face resistance around $78,650, followed by $80,907 and the recent swing area between $82,000 and $82,300.
4-hour Supertrend turns bearish below $79,676
The 4-hour chart presents a weaker short-term setup. Bitcoin closed the latest displayed candle around $77,276 after trading between $76,676 and $77,959.
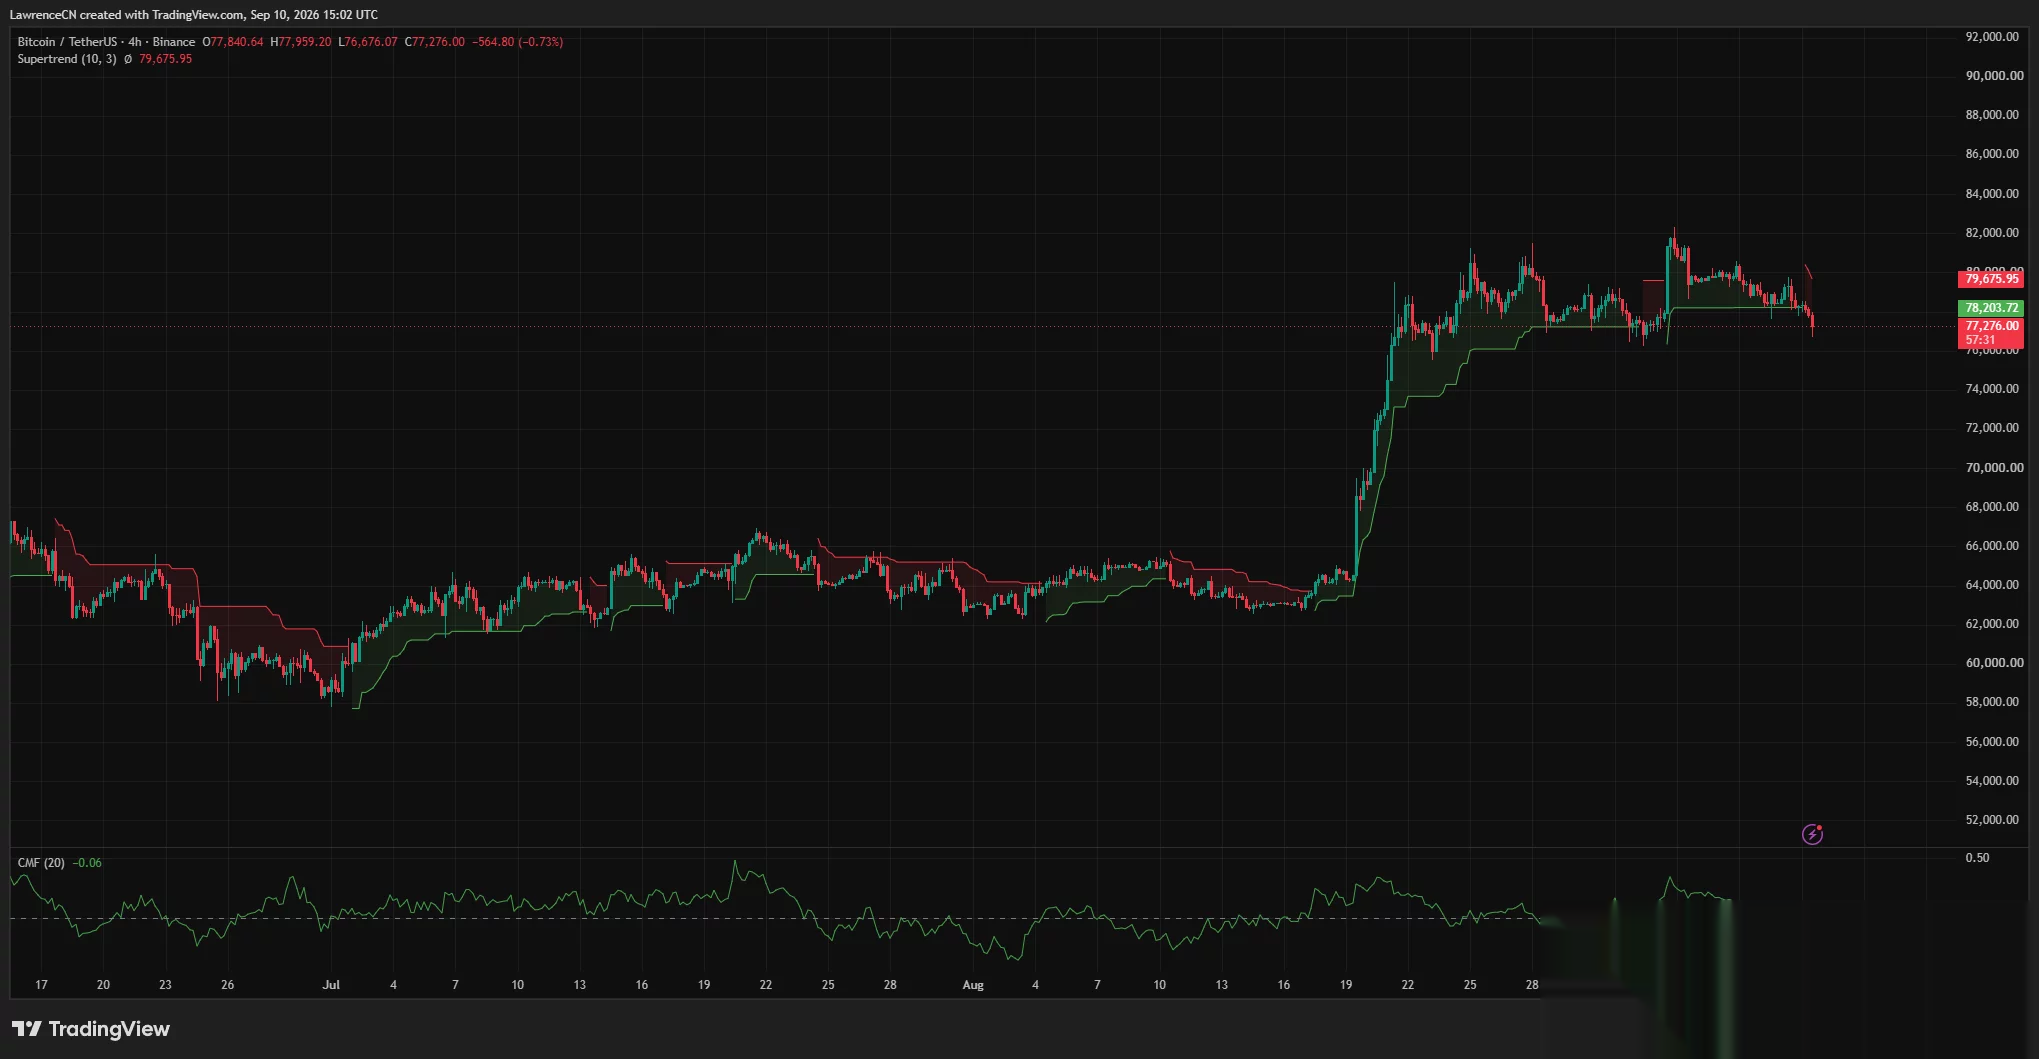
Price has fallen below the former Supertrend support near $78,204. The indicator has switched to a bearish reading, with resistance now positioned at approximately $79,676.
The change means Bitcoin would need to reclaim both $78,204 and $79,676 to weaken the current sell signal. Failure to recover those levels would leave sellers in control of the lower-timeframe trend.
Chaikin Money Flow stood at -0.06 on the 4-hour chart. A negative reading indicates that selling pressure and capital outflows outweighed buying activity during the indicator’s measurement period.
The price decline and negative CMF reading support the bearish Supertrend signal. However, Bitcoin’s bounce from the $76,676 intraday low shows that buyers remain active above the daily lower Bollinger Band.
Liquidation heatmap places major liquidity near $80K
CoinGlass’s three-day liquidation heatmap shows several concentrated liquidity zones on both sides of Bitcoin’s current price.
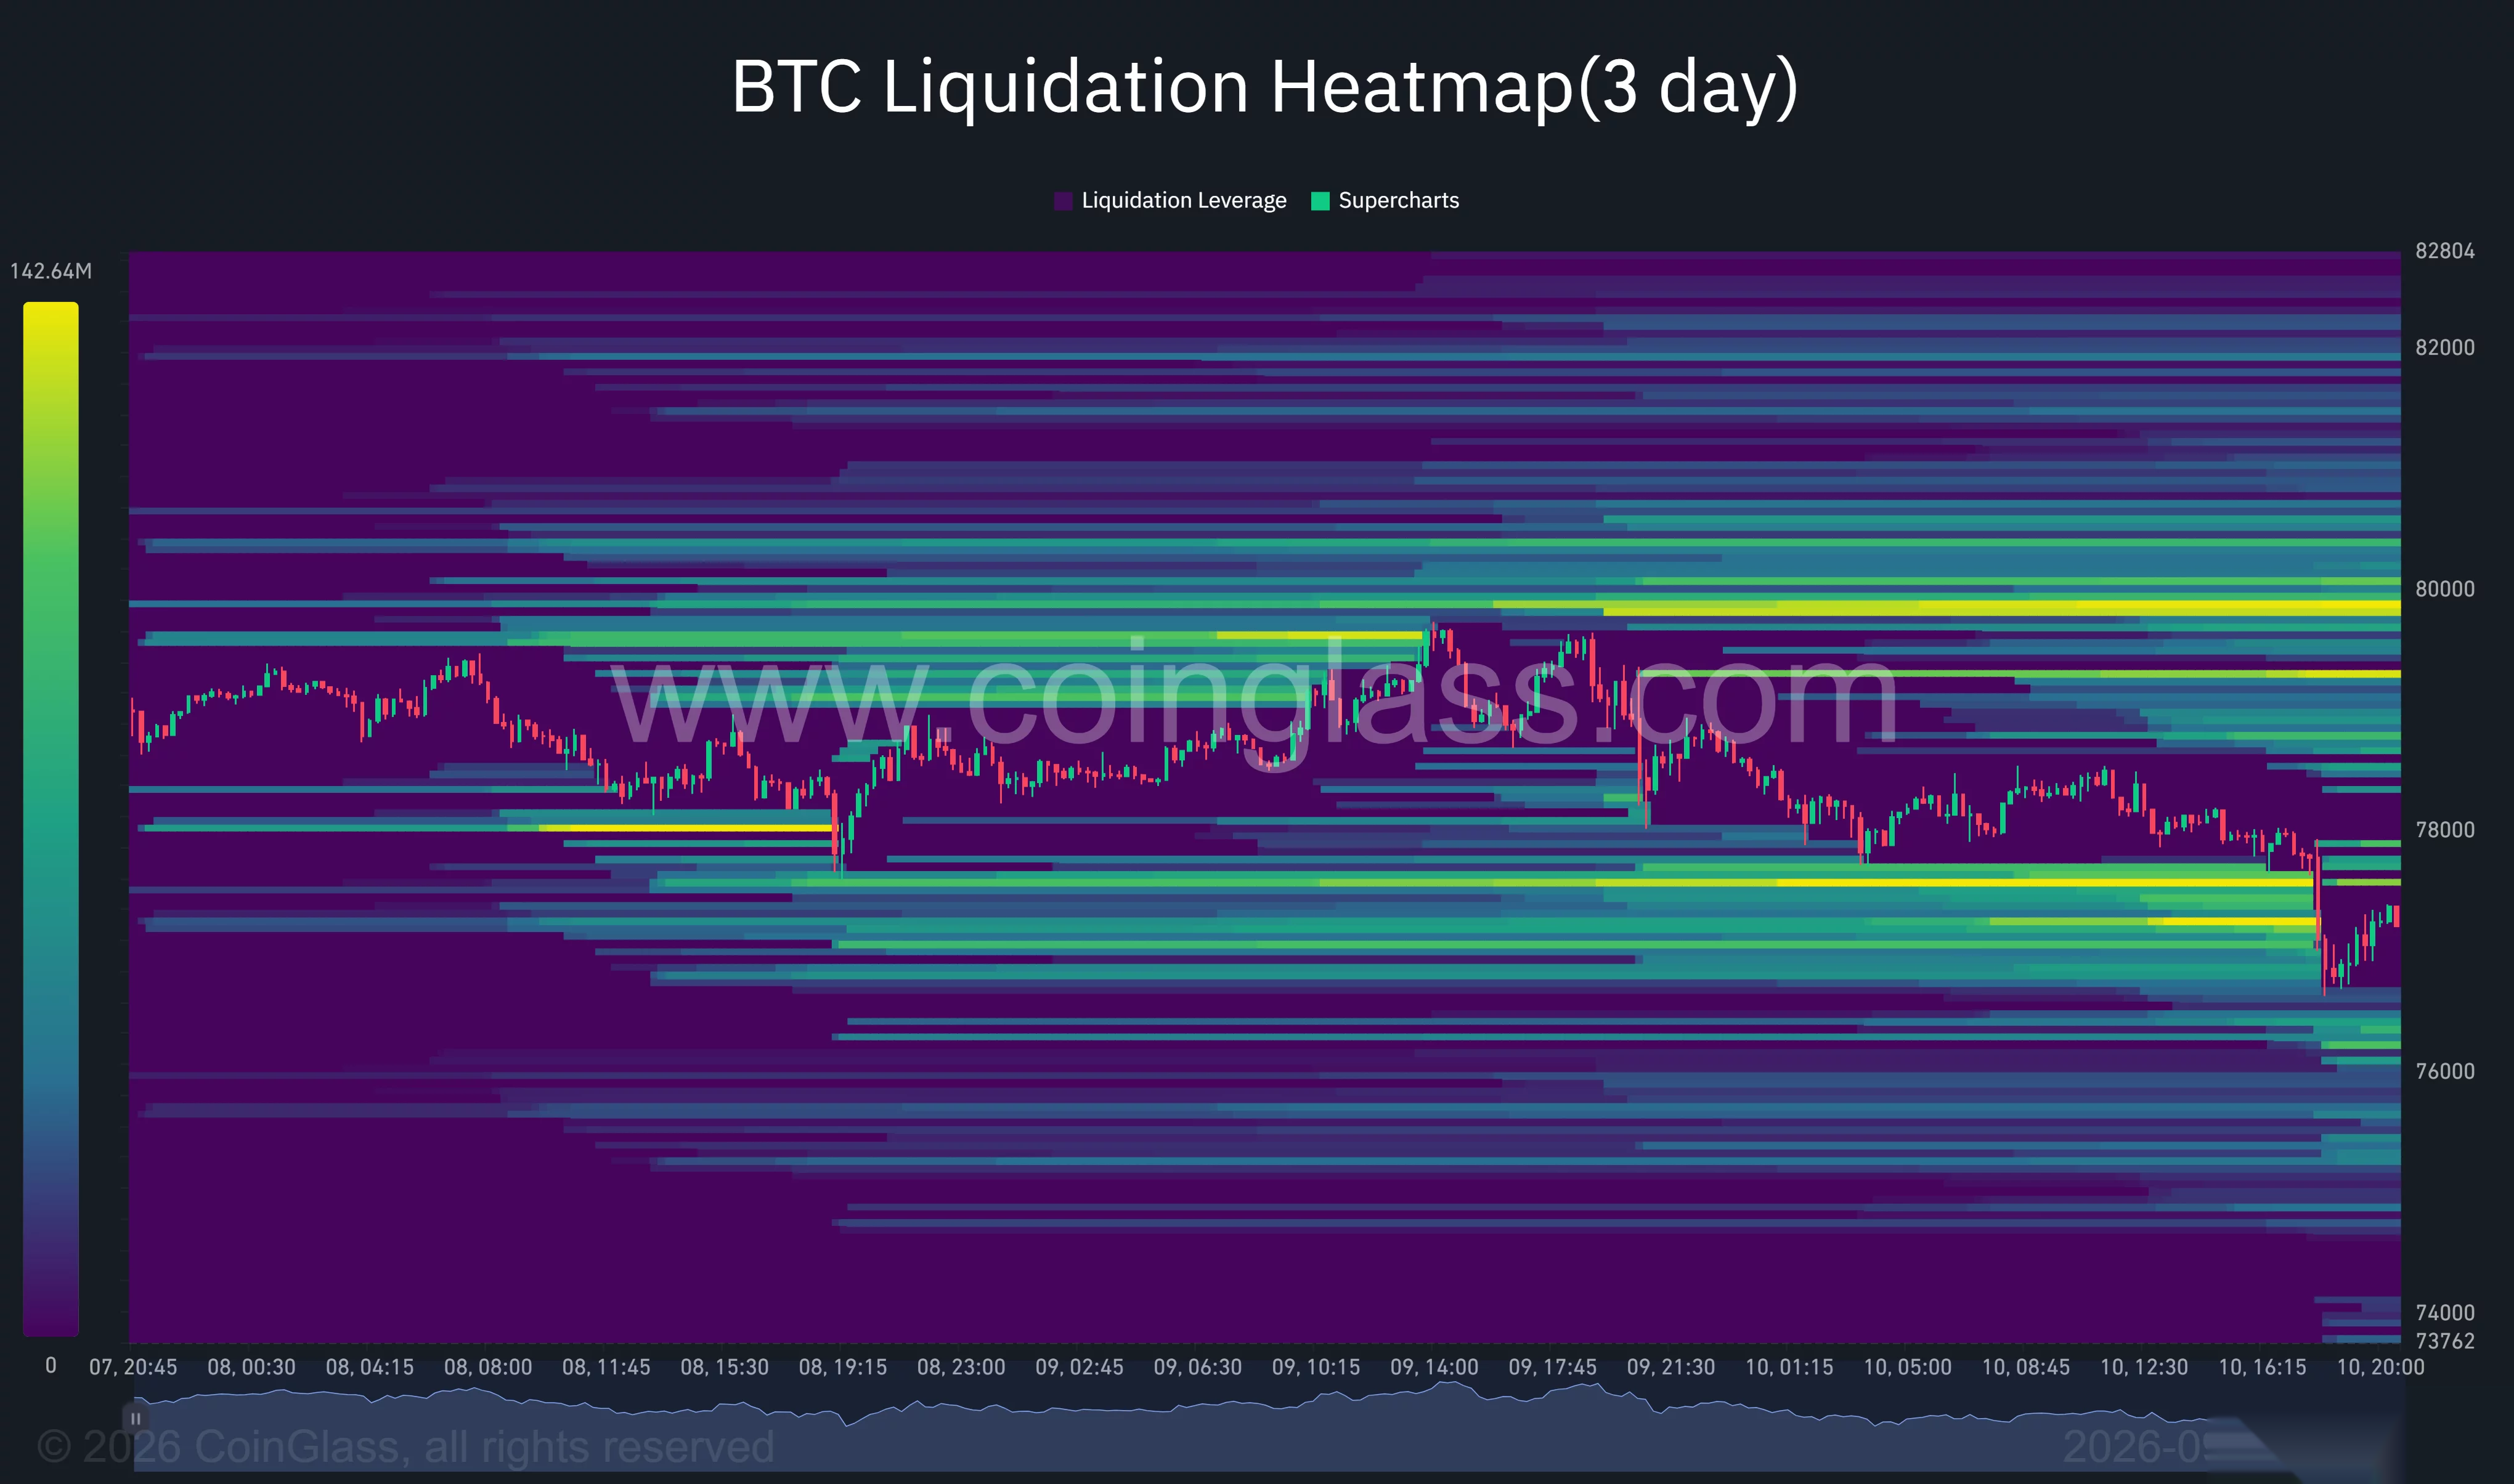
The most notable overhead cluster sits between roughly $79,500 and $80,000. Additional liquidity appears around $79,200, with smaller bands extending above $80,000. A recovery through $78,200 could draw the price toward those levels as short positions face growing liquidation risk.
Liquidity below the market is concentrated around $76,800 to $77,500, where the latest selloff appears to have cleared part of the accumulated leverage. Further bands remain near $76,000 and between $74,000 and $75,500.
Liquidation heatmaps identify areas where leveraged positions may be forced to close, but they do not determine price direction. Bitcoin could move between the nearest clusters as traders reduce exposure before the Fed decision.
US inflation and ETF outflows add pressure
CME FedWatch data placed the probability of a 25-basis-point September rate increase at about 60%, up from earlier expectations. Such a move would lift the federal funds target range from 3.50%–3.75% to 3.75%–4.00%.
Institutional demand also weakened before the meeting. U.S. spot Bitcoin ETFs recorded $201.9 million in net outflows on Aug. 29, ending a nine-day inflow streak, although the week still finished with $924.5 million in net inflows.
The technical setup leaves $76,392 as the main near-term support. A break below it could extend the decline toward $76,000 and $74,000, while a recovery above $78,650 would give bulls another chance to target the liquidation cluster near $80,000.