Author: Benson Sun (@BensonTWN)
In the week of August 22, BTC surged 24%. Suddenly, the market was abuzz: Is the bull market already here? Many people still remain skeptical.
Let me state the conclusion first: I believe what's coming is not just a bull market, but a major bull market of a large magnitude.
Bitcoin's Golden Bloodline Fully Awakens
Let's start with something unusual.
In the same week BTC surged, gold rose 5.6%, while Nasdaq fell 2.1%.
In the past few years, people have been accustomed to treating BTC as a high-beta tech stock. When U.S. stocks were risk-on, BTC would surge along; when U.S. stocks tightened liquidity, BTC usually fell faster.
But this time the movement is different. After August 17, BTC and gold both strengthened simultaneously, while Nasdaq stayed flat.
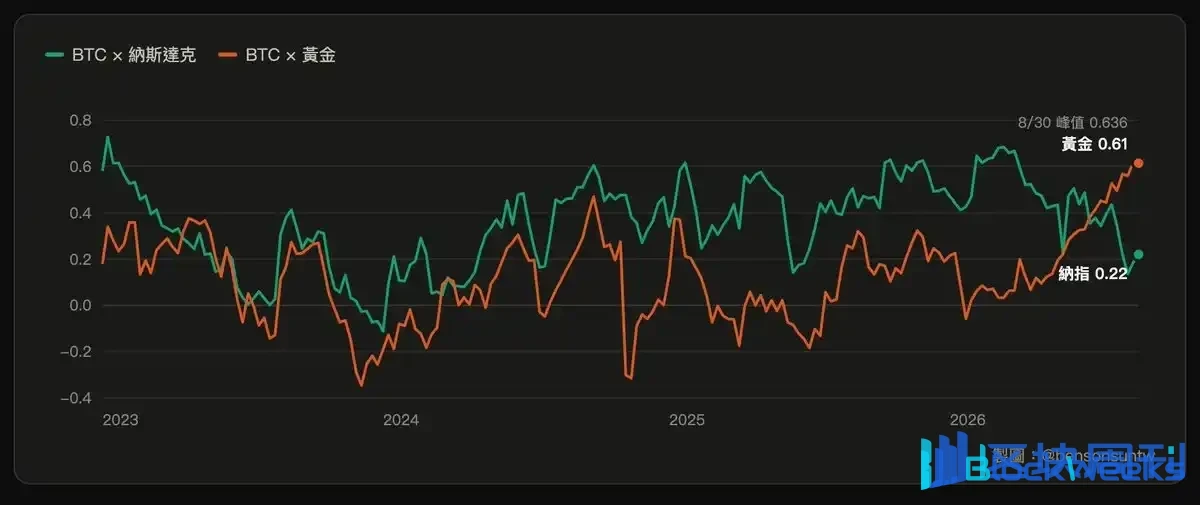
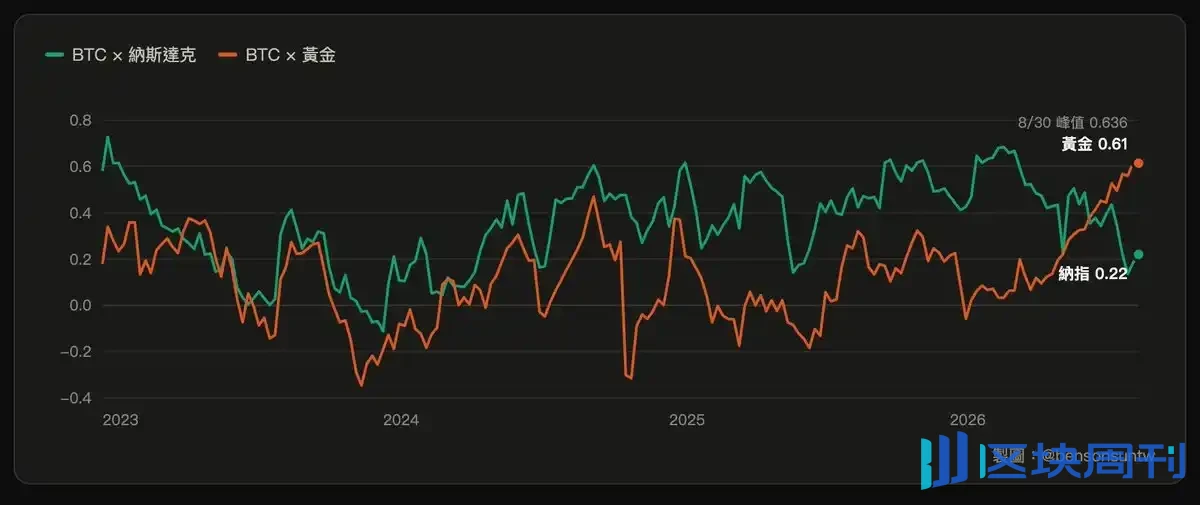
In fact, since May, the 60-day correlation coefficient between BTC and gold has been soaring, reaching a high of 0.636, approaching the historical peak (0.64 in November 2020, with a long-term median of only 0.12). At the same time, the correlation coefficient between BTC and Nasdaq has been declining, reaching a low of 0.13, and currently rebounding to 0.22.
How rare is it for this orange line to stand above 0.5? Since BTC has trading records, such trading days account for only 2.2%. Before this round, it had only occurred in two periods in history: August 2020 and October 2022.
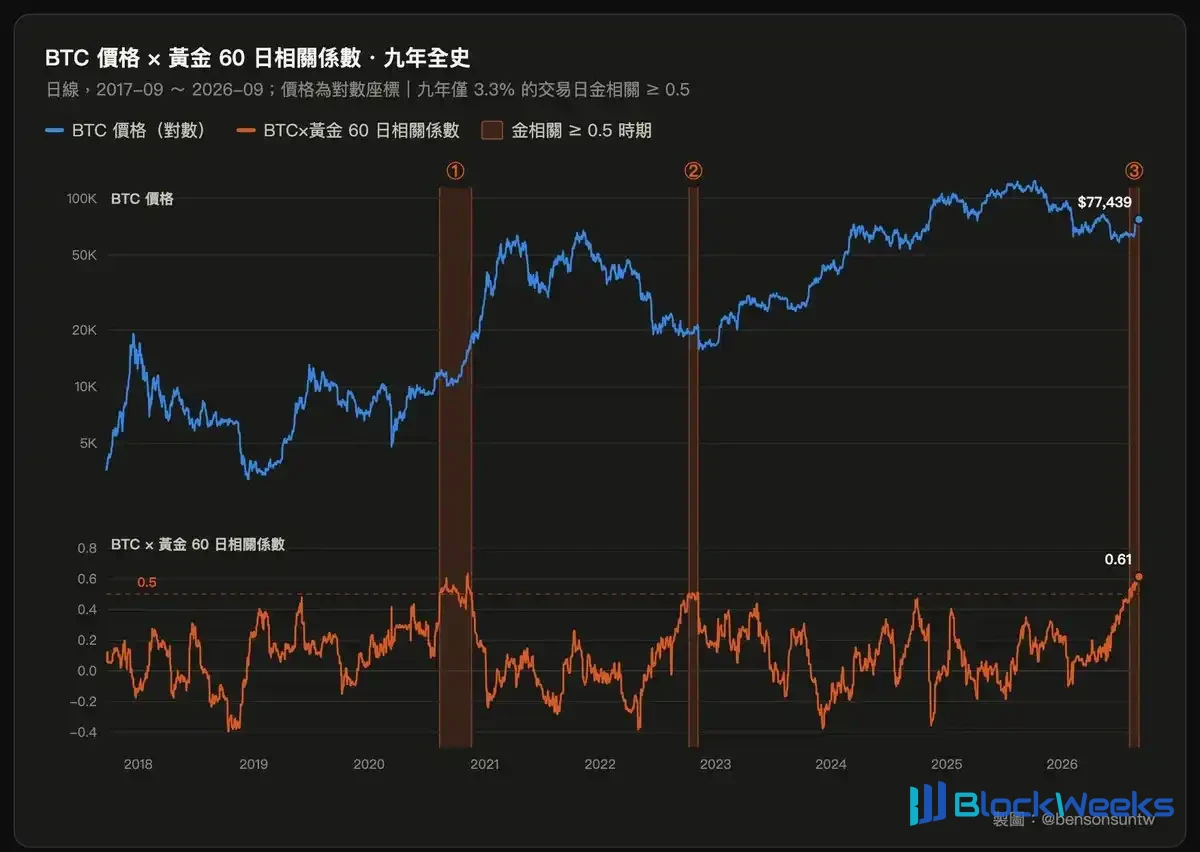
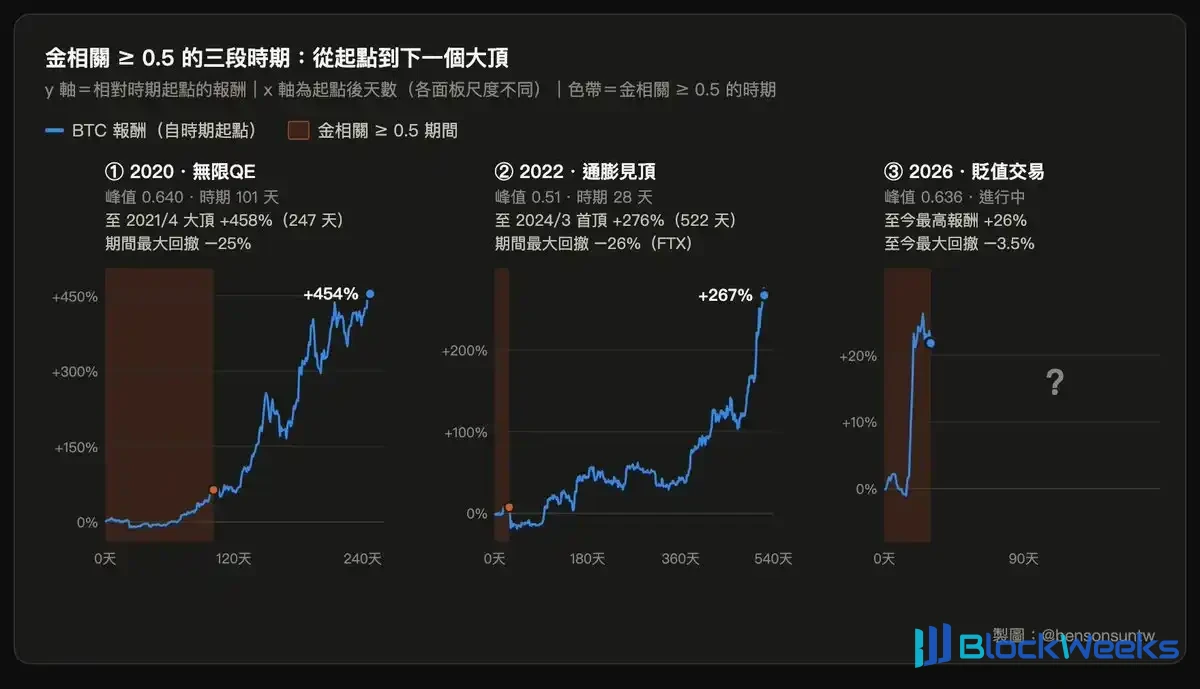
Looking back, August 2020 was exactly the eve of the main upward wave of a major bull market. At that time, BTC was still trading sideways around $10,000–$12,000. A few months later, it broke through the previous high and eventually rose all the way to $64,000, with a maximum gain of +458%.
The October 2022 episode was bumpier. BTC was initially bottoming around $20,000. In November, the FTX collapse black swan occurred, and the price was smashed to $15,700. But from a full cycle perspective, October 2022 had already fallen into the long-term bottom zone. Calculated from the signal price at that time, the maximum gain to the subsequent high of 73K was +276%.
And now, this is the third period in history when BTC and gold are highly correlated. But if history rhymes, now might be the starting point of a bull market.
And this time there is another very different aspect.
In the 2020 round, the median correlation between BTC and Nasdaq was still 0.44. At that time, under the environment of comprehensive QE, all assets were pushed up by the same liquidity.
In the 2022 round, BTC's correlation with Nasdaq was even higher than with gold, reaching 0.62.
Only this time: the correlation with gold has broken above 0.6, while the correlation with Nasdaq has dropped below 0.25. Such a combination is unprecedented in history.
If we interpret correlation as the market using a certain logic to price BTC, then among the three periods of high gold correlation, this time is the purest pricing structure of "inflation-resistant hard assets."
If we look more closely at the relationship between the gold correlation coefficient and the cycle, we will see a recurring phenomenon:
After BTC's drawdown from the previous high exceeds 25%, the 60-day correlation coefficient with gold quickly rises above 0.4 from a low level. This has occurred four times in history: December 2018, October 2022, September 2024, and June 2026. The first three signals all fell near important bottom zones in hindsight. If history rhymes again, 57K to 58K is likely to be the bottom zone of this cycle.

This phenomenon itself is very interesting. Although BTC is touted as digital gold, when you look at historical data, the long-term median correlation coefficient between BTC and the Nasdaq is 0.45, and with gold it is only 0.12. Normally, it doesn't behave like gold at all, but rather like a high-volatility beta tech stock.
So why does BTC experience a surge in gold correlation at the end of every cycle's bottom?
My hypothesis is: there are two factions of capital playing BTC in the market, with completely different trading logic.
One faction treats it as a high-risk growth stock for short-term trading. When this faction has the say, BTC's trend is tightly bound to the Nasdaq.
The other faction truly regards it as a long-term target for "hedging against fiat currency depreciation," that is, capital that buys into the "digital gold" narrative.
During a sharp price decline, the first group of short-term capital runs away the fastest. When the price falls into the bottom zone and chips gradually concentrate in the hands of the second group of long-term investors, the market's pricing dominance changes hands.
When more and more buyers price BTC using the "hard asset" logic, the digital gold narrative is also brought out for speculation. Eventually, the market will show BTC and gold moving more and more in sync.
Karma Index Reveals Cycle Position in Early Bull Market
If the gold correlation coefficient observes BTC's current pricing logic from an external macro perspective, then the Karma Index judges whether this washout is sufficient from market sentiment and cycle position.
The Karma Index is a cycle indicator developed by CoinKarma, integrating nine dimensions such as market liquidity, funding rates, on-chain costs, app rankings, and search popularity, into a market thermometer from 0 to 100 to measure the position in the major cycle. Above 80 indicates overheating, below 20 indicates extreme fear.

As can be seen from the chart above, before this rally, the Karma Index was at a low level for a long time, and during that period it also fell below 20 into the extreme fear zone multiple times, similar to the sentiment characteristics of past important bottoms.
Since 2017, "BTC rising more than 20% in a single week" has occurred 27 times, and including this time, it is the 28th.
For the previous 27 times, if you chased the high after the surge, the median return after six months was only +3.6%, while the median return for buying on a randomly selected trading day during the same period was +13.9%. Therefore, "chasing the high after a 20% single-week surge" has no advantage at all based on historical samples.
But if the Karma Index is taken into account, the situation is completely different: when the average Karma Index in the 60 days before the rise was below 30, there were only 8 instances that matched, with a total of 6 wins and 2 losses, the win rate jumped to 75%, and the median return surged from +3.6% to +49.4%.

Looking at the Nasdaq, the results are even more interesting.
Among the above 8 instances, only 3 were cases where BTC still rose more than 20% on its own while the Nasdaq did not rise during the same period:
In December 2018, it rose +124.3% after six months.
In May 2019, it rose +30.2% after six months.
In October 2023, it rose +93.7% after six months.
These three instances occurred respectively at the major bottom of the bear market, the starting point of the main upward wave, and the starting line of the ETF bull market, and all maintained positive returns after six months.
And this time, the average Karma Index in the 60 days before the rise was only 19.5, ranking the third lowest among the 9 low-sentiment samples including this one; during the same period of BTC's surge, the Nasdaq also fell by 2.1%.
In other words, this time it also fits the structure of "after a long period of low-sentiment washout, BTC breaks away from the Nasdaq and surges independently," becoming the fourth time in history.
Putting all the previous data together, we can summarize two things:
First, BTC's correlation with gold has risen to a historically rare level. In the past, when such signals appeared after significant pullbacks, they almost always fell near important bottoms.
Second, the Karma Index shows that this washout has been quite sufficient. Historically, when the market has been in low sentiment for a long time and then surges, subsequent performance is usually much better than simply chasing the high.
One looks at cross-asset pricing, the other looks at cycle sentiment; both support the claim that we are currently in the early stage of a bull market.
Many people are now afraid of heights because BTC has been in a bear market for too long, and everyone has been anchored.
Especially in the recent period, US stocks and gold have been rising every day, but BTC has been falling all the way. After being tormented for a long time, it is natural to feel that every rebound is an opportunity to escape, and the faster it rises, the more afraid they are to buy.
But looking at the trend of the past two weeks, BTC's relative strength has clearly changed. It is not only stronger than US stocks, but gold is also left behind by it.
The most tormenting thing about a bear market is that no one knows how deep the bottom is. The end of 2018 is the most typical example. At that time, many people were buying the dip all the way from $6,000, and BTC could still halve to $3,000. Many people bought the dip until their mentality collapsed, and as soon as they recovered their capital, they sold everything.
Looking back afterwards, the most comfortable buying point during that round of holding was actually the period when BTC suddenly pulled from over $3,000 to $4,000. Although the cost was higher than the lowest point, the certainty was much higher, because the main upward segment was just about to begin.
I believe this is the same buying point now. All historical samples that match "high gold correlation + independent market from US stocks + Karma Index washout" are all in the early stage of the main upward wave of a bull market.
What Kind of Bull Market Will This Be?
In the past few rounds of BTC bull markets, the upward fuel mainly came from the halving narrative and the spillover of dollar liquidity. "Digital gold" has been mentioned in every round, but it mostly stayed at the thematic level and rarely truly became the main line.
This time, I think the situation is somewhat different.
Recently, the 30-year US Treasury yield once rose to 5.34%, a new high since 2007. The higher the yield, the higher the return investors demand to be willing to lend money to the US for the long term.
The US is now carrying nearly $40 trillion in debt. The higher interest rates are maintained, the heavier the refinancing cost after old debts mature, interest expenses continue to push up the deficit, and the government has to issue more debt.
These problems have actually existed for a long time, but what is more noteworthy is that the market has begun to become very sensitive to this matter.
On August 19, the US Treasury announced that it would at least double the liquidity support repurchase ceiling for long-term Treasury bonds. After the announcement, long-term bond yields fell, and gold and BTC surged simultaneously. The market quickly interpreted this as the Treasury being willing to inject liquidity to maintain the normal operation of the long-term bond market.
By September 4, the direction completely reversed. US non-farm payrolls increased by 162,000, far higher than the market expectation of 56,000, and the probability of a rate hike was once pushed to 65%. US Treasury yields rose rapidly, the dollar strengthened, and US stocks, gold, and BTC were all hit at the same time.
A few months ago, a non-farm payroll report might not have caused such a big reaction across the entire market. Now the wind has clearly changed. Everyone has begun to stare at the Fed, long-term bond yields, and liquidity, and the market's nerves have tightened.
For the asset market, the US debt problem will probably eventually be traded into two paths.
The first path is to rely on AI to make the pie bigger. If productivity improves, corporate profits and economic growth outpace debt expansion, the debt-to-GDP ratio will naturally decline.
The second path is to gradually dilute the real value of debt through monetary expansion and inflation. The former corresponds to AI stocks, and the latter corresponds to gold and BTC.
In the past few years, the market has placed a large amount of capital on the first path, that is, the productivity revolution brought by AI. If the market begins to shift more attention back to debt, liquidity, and fiat purchasing power, the anti-depreciation trade is likely to return to the center of the market.
And the impact of this issue is very broad. Everyone in the world holding cash, government bonds, pensions, and fiat assets has to face the same thing: how much purchasing power will the money in hand have in ten years? As long as the market begins to doubt whether sovereign debt can expand without continuously diluting the currency, capital will naturally look for assets with limited supply that cannot be arbitrarily issued.
Gold is the most traditional answer. BTC is becoming another answer.
Previously, even if institutions recognized BTC as digital gold, they still had to deal with a whole series of issues such as exchanges, private keys, custody, compliance, and accounting. The spot ETFs approved in the last cycle have truly paved the way.
Now, asset management companies, family offices, pension funds, and even general brokerage accounts can directly allocate BTC using familiar financial instruments. The narrative has long existed. This cycle, there are compliant gateways that can accommodate large amounts of capital.
This is also why the synchronization between BTC and gold in this cycle is more noteworthy than in the previous two. The correlation with gold has risen to historically rare highs, while the correlation with Nasdaq remains low. From the perspective of the upward logic, this may be the closest BTC has ever been to gold in its history.
If "resisting fiat currency depreciation" truly upgrades from a theme that is hyped every cycle to the main market narrative of the next phase, the capital pool BTC faces will be completely different.
If BTC in this cycle begins to absorb the hedging demand for currency credit, sovereign debt, and purchasing power decline in global asset allocation, it could be the largest batch of capital in BTC's history.
If this macro main line truly fully unfolds, what we are seeing now is likely just the starting point of a major bull market.