Written by: Rita
Gold has fallen only 10% from its August high and remains slightly above $4,000/oz. Based on the real yield relationship from March to July 2026, this level corresponds to below $3,000/oz, 28% below the current price. Placed side by side, the two numbers point to the same thing: the anchor of gold pricing has changed.
Morgan Stanley provided a judgment framework in its October 26, 2026 report. Gold's hedging function against equities has failed since 2020, while it still provides a buffer during the worst weekly bond selloffs. Central bank purchases and ETF inflows have held gold above $4,000/oz, and gold's safe-haven role has shifted from equity risk to bond and sovereign risk.
Morgan Stanley maintains gold as its top pick among metals, with a target price of $5,000/oz by the second quarter of 2027. The catalyst is fewer Fed rate hikes than the market has priced in, and the risk is further tightening and a stronger dollar.
Equity hedging has failed
Since 2020, the correlation between gold and the S&P 500 has turned positive. The report's tables classify gold's hedging against equities as ineffective across daily, weekly, and monthly horizons. During the worst 5% of equity selloffs, the correlation between gold and equities is higher, amplifying portfolio downside. Treasuries remain a strong hedge during daily equity declines.
The efficient frontier from 2006 to 2026 shows that adding gold raises risk-adjusted returns. The source is gold's contribution to returns in years when it outperformed bonds by more than 8.5%. Gold does not lower the portfolio's risk floor. In 2012, 2013, and 2021, gold outperformed bonds by less than 8.5%, and the efficient frontier reverted to its 1990-2005 form.
From 1990 to 2005, gold was negatively correlated with equities, and adding it to an equity-bond portfolio did not improve the efficient frontier. Gold's volatility was close to that of equities, and its correlation was unstable. Morgan Stanley uses coskewness to judge safe-haven status, as the right tail of the extreme return distribution matters more than everyday correlation. After 2020, gold exhibits negative coskewness during extreme drawdowns, and its safe-haven property has disappeared.
Bonds are gold's real battleground
Gold's buffer against Treasuries appears during the worst weekly selloffs. The report's tables show that since 2020, during the worst weekly declines in Treasuries, gold reduced portfolio losses. The sample points are few, but Morgan Stanley still views gold as a ballast against bond volatility. The 12-month rolling correlation between Treasuries and gold has declined since 2020, returning to mid-2000s levels.
With fiscal sustainability and inflation expectations heating up, the safe-haven status of government bonds is being questioned. Treasuries continue to provide a hedge during daily equity declines, and gold fills the corner where bonds fail. Investors' reason for holding gold has shifted from equity hedging to sovereign risk hedging.
Morgan Stanley describes gold's role as ballast, with the object shifted from equities to bonds. This judgment does not depend on gold returning to its old pattern of negative correlation with equities. What the report values is gold's buffering ability during the worst weekly bond selloffs. The declining correlation between Treasuries and gold leaves room for a new allocation rationale for gold.
Real yields cannot explain gold prices
In September, the Fed raised rates for the first time since 2023. The U.S. 10-year Treasury yield rose to its highest since the early 2000s, dominated by real yields. Gold has fallen only 10% from its August high and remains slightly above $4,000/oz. Based on the relationship between gold prices and real yields from March to July, gold should be below $3,000/oz, 28% lower.
The gap comes from structural demand. Central bank purchases and ETF inflows have made gold less dependent on the interest rate environment. The memory of stocks and bonds falling together in 2022-2023 has led investors to ask again about gold's role. Morgan Stanley's answer is differentiated by object: against equities, gold has failed since 2020; against bonds, gold can still buffer the worst weekly selloffs.
Gold pays no interest, and rising rates raise the opportunity cost of holding it. Central bank and ETF buying offset this opportunity cost. ETF holdings and gold prices diverged after tracking closely since mid-2024. Morgan Stanley attributes the divergence to demand for hedging fiscal and sovereign risk.
Central banks and ETFs hold up gold prices
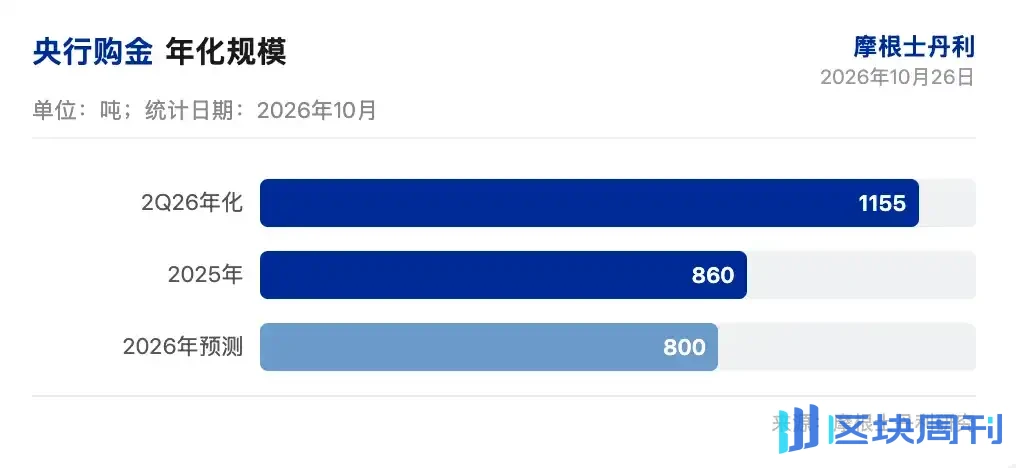
Central bank purchases reached 289 tonnes in 2Q26, an annualized 1,155 tonnes. Full-year 2025 was 860 tonnes, and Morgan Stanley forecasts 800 tonnes for 2026.
The People's Bank of China bought 103 tonnes year-to-date, with 60% occurring in 3Q. Poland added 123 tonnes year-to-date and may again be the largest buyer. China's gold imports reached 1,300 tonnes by September, the fastest annualized pace since at least 2017.
ETF inflows were $31 billion in 3Q, about 220 tonnes, and about 250 tonnes year-to-date. ETF inflows of 800 tonnes in 2025 drove gold prices higher. Inflows slowed in 2026, with 3Q setting a record quarterly inflow in dollar terms. ETF buying appeared in the same quarter as the Fed's first rate hike.

Central bank and ETF demand have held gold above $4,000/oz. Morgan Stanley believes central bank purchases reflect hedging of geopolitical and fiscal risk, while ETF inflows reflect investors pricing sovereign risk. Central bank gold sales are a risk, with Kazakhstan planning to cut gold's share of reserves from 78% to 75%.
$5,000 hinges on fewer hikes priced
Morgan Stanley gives gold a $5,000/oz target, corresponding to the second quarter of 2027. The market prices one hike by year-end and 2.5 hikes in 2027. Morgan Stanley economists expect two hikes by the end of 2027, while the market prices 2.7. Fewer hikes than priced means lower yields and a lower opportunity cost for gold.
The U.S. Treasury bought back long-term Treasuries in August, yields briefly stabilized, and gold prices surged. Recent remarks by Treasury Secretary Bessent suggest limited willingness for further intervention, and the November 4 refunding announcement is a point to watch. A steeper yield curve could also raise gold's appeal: the long end stays high on fiscal concerns, while the short end falls as hike expectations decline.
Oil prices affect short-term rhythm. Since the Middle East conflict, gold has averaged a 0.2% gain on days when oil falls and a 0.5% loss on days when oil rises. When Brent crude rose above $110/barrel, gold fell toward $4,000/oz.
Morgan Stanley views such pullbacks as buying opportunities, provided oil stays high and raises stagflation risk. Stagflation weighs on stocks and bonds, and gold has historically performed relatively strongly. Risks are further Fed tightening, a stronger dollar, central bank gold sales, and a break below technical levels.

This article is Chaoxiang Research's compilation and interpretation of a third-party brokerage research report (Morgan Stanley, October 26, 2026), combined with publicly available market information. The ratings, target prices, earnings forecasts, and related judgments cited in the article are all views of the brokerage's analysts and represent only the positions of their institutions, not those of Chaoxiang Research, and do not constitute any investment advice.
Markets carry risk, and decisions must be independent. This article should not be used as a basis for buying or selling any securities.