

PEPE price has jumped nearly 12% over the past 24 hours to approximately $0.0000048 on October 28, as reports of substantial holdings linked to Tron founder Justin Sun attract traders while derivatives activity and exchange withdrawals pick up.
Summary
- PEPE price gained nearly 12% as Arkham identified $51.25 million in holdings linked to Justin Sun.
- Sun-linked wallets reportedly control 2.82% of PEPE’s supply, increasing attention to large-holder activity.
- Santiment recorded 4.77 trillion PEPE leaving exchanges on October 16, followed by partial reversals.
- CoinGlass data showed rising futures activity, alongside a reported $1.39 million in spot outflows.
- PEPE price faces resistance around $0.0000050, with $0.0000055 and $0.0000060 as potential upside targets.
According to crypto.news market data, the meme coin traded between $0.0000043 and $0.0000050 over the past day, with trading volume near $476 million and market capitalization above $2 billion. The token has gained approximately 15% over the past month, although it remains well below its December 2024 record of $0.000028.
The latest recovery follows reports that wallets attributed to Sun hold roughly $51.25 million in PEPE, representing 2.82% of its supply. That concentration has attracted attention.
PEPE price rises after Justin Sun whale accumulation report
Blockchain analytics firm Arkham Intelligence identified a substantial position across known and suspected Sun-linked wallets on October 27. As crypto.news reported on Sun’s holdings, the addresses received 11.85 trillion PEPE through two major withdrawals from Poloniex on October 17 and October 26.
The transfers were worth approximately $48.76 million when recorded, while the combined holdings subsequently reached around $51.25 million. Arkham described Sun as the largest individual PEPE holder outside exchanges, based on its wallet attribution.
The transactions attracted attention during PEPE’s recovery, although holdings concentrated in a few addresses create a separate risk. A large transfer back to an exchange could add selling pressure if the tokens are subsequently offered for sale.
Moreover, Onchain Lens reported another whale deposit involving 366.97 billion PEPE, valued at approximately $1.64 million, to Coinbase on October 28. The tracker suggested a possible sale.
Meanwhile, on-chain tracker Lookonchain reported that two previously dormant PEPE whales transferred a combined 2.27 trillion tokens worth approximately $10.19 million on October 28. The transfers add to recent large-holder activity, although the destination and purpose of the movements remain unclear.
Exchange withdrawals support PEPE price recovery
On-chain activity leading into the latest rally showed substantial movement away from centralized exchanges. Last Friday, Santiment reported that exchange-held PEPE supply fell by 4.77 trillion tokens on October 16, its largest one-day decline since at least October 2.
That session included 15 transfers exceeding $1 million and approximately $20 million in net exchange outflows. Santiment said the outflows ran roughly eight times their October 11–15 average, before PEPE gained around 13% between its October 17 and October 22 closing prices.
However, the subsequent flows were mixed. Between October 19 and 22, exchange supply recovered by 2.11 trillion tokens, reversing more than 40% of the October 16 decline.
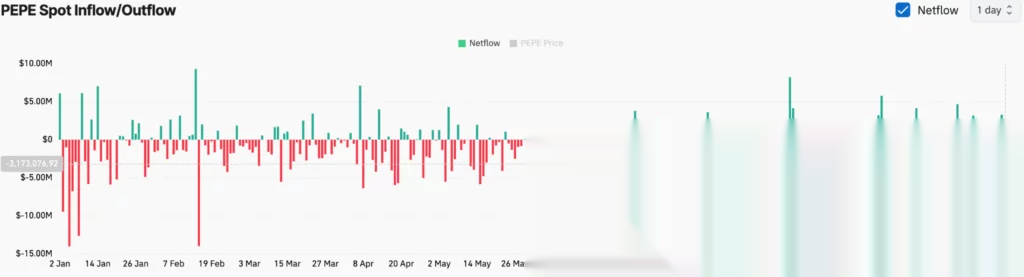
CoinGlass data showed renewed net spot outflows of $1.39 million at press time, consistent with further token withdrawals. The movements may indicate accumulation or transfers to private wallets, but they cannot establish the intentions of individual holders.
PEPE futures activity rises as traders return
Derivatives trading has become more active alongside the spot-market recovery. CoinGlass data showed futures volume rising 72.67% to $587.89 million, while open interest climbed 7.10% to $316.14 million.
Higher open interest indicates that outstanding futures exposure has grown, although the figure does not distinguish between bullish and bearish positions. The volume increase shows stronger participation but cannot independently establish whether traders expect further gains.
The combination of rising prices and open interest is consistent with fresh leveraged positioning. However, the direction of that exposure requires additional evidence from funding rates, long-short ratios and liquidation activity.
The latest rally follows an October technical assessment that identified resistance near $0.00000469, alongside an amended registration statement for Canary Capital’s proposed PEPE exchange-traded fund. The filing remains a proposal, not evidence of an operating ETF or completed investment inflows.
PEPE price prediction: Can bulls clear $0.000005?
PEPE’s daily technical indicators show improving momentum as the token approaches the $0.0000050 resistance area. The chart readings place the relative strength index at 61.37, above its 54.41 moving average and the neutral 50 level, but below the conventional overbought threshold of 70.
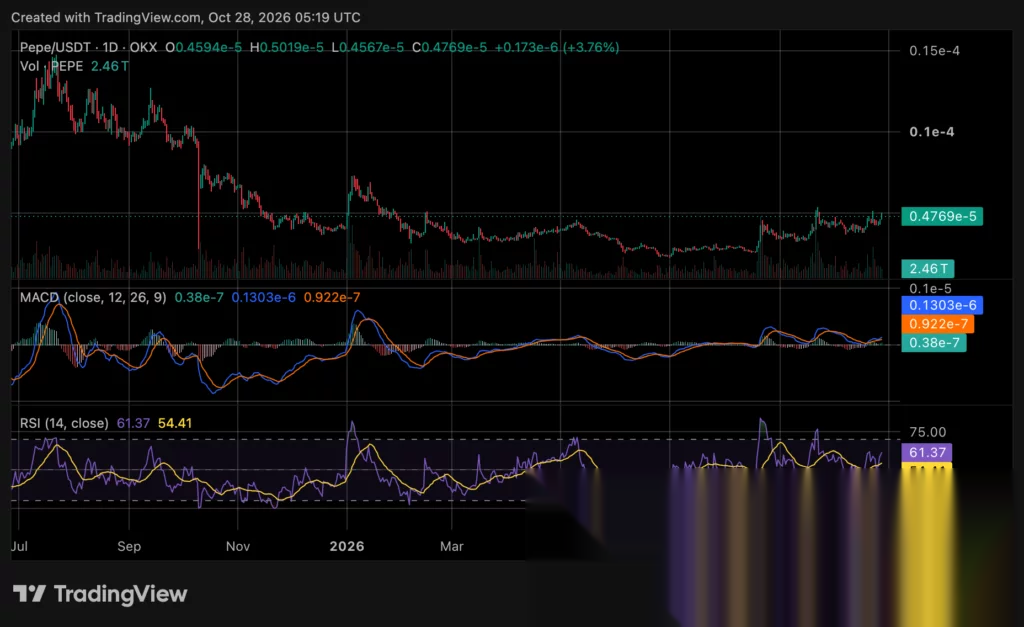
The MACD line stands near 0.0000001303, above its signal line of 0.0000000922, with a positive histogram around 0.000000038. The readings indicate positive momentum, although they do not establish that a sustained price breakout has occurred.
Crypto analyst Crypto With Gopal identified a potential double-bottom formation, with buyers defending support around $0.0000042. Trader Symba separately identified resistance near 0.00000453–0.00000454, followed by possible recovery targets toward $0.00000470 and $0.0000050.
With PEPE price already trading above those initial levels, attention has moved to whether the price can secure a daily close beyond $0.0000050. A confirmed breakout would bring $0.0000055 and $0.0000060 into focus, while rejection could expose support around $0.0000045 and subsequently $0.0000040.
The October 5 analysis identified $0.00000417 as nearby support and noted that weekly money flow remained slightly negative despite an improving chart pattern. Those historical readings provide context but do not replace the latest daily indicators.