Issue 16 built an entire issue on one transmission chain—oil into the front end, the front end into the wrapper bid—and then named five things that would test it. All five resolved inside the three weeks of July 27 to August 16. The first two links ran backwards almost exactly. The third did not follow. Brent's September contract fell 8.7% on Monday July 27 to close at $88.36, and WTI gapped about 5% lower to around $85 [1][2]. Issue 16's floor under $90 broke on the window's first trading day. Three weeks later, on August 14, Brent settled at $88.52 and WTI at $82.40 [3]. The benchmark travelled a long way to end sixteen cents from where it started.
The rates market took back its hawkish repricing on the same schedule. The July 29 FOMC held the target range at 3.5% to 3.75% on a 9-3 vote, with Beth M. Hammack, Neel Kashkari and Lorie K. Logan preferring a quarter point [4]. Then payrolls fell 23,000 on August 7 against expectations of 83,000 to 95,000 [5][6]. September pricing collapsed, and the two-year Treasury ended August 14 at 4.17% against roughly 4.33% on July 24 [7].
And the money-fund drawdown Issue 16 was tracking reached its third week and was then erased. Assets fell $6.8 billion in the week ended July 29 on Crane Data's account of the ICI print, then rose $55.4 billion and $18.26 billion, closing at $7.93 trillion [9][10].
Almost everything Issue 16 worried about reversed—and bitcoin still finished lower. BTC opened July 27 at $65,333.12 and August 14 at $63,418.16 [11][12]. The chain Issue 16 asserted was tested in the other direction, and it broke at the last link.
Three weeks of July 27 to August 16, 2026
Bitbase Research · August 24, 2026
The one chart that matters
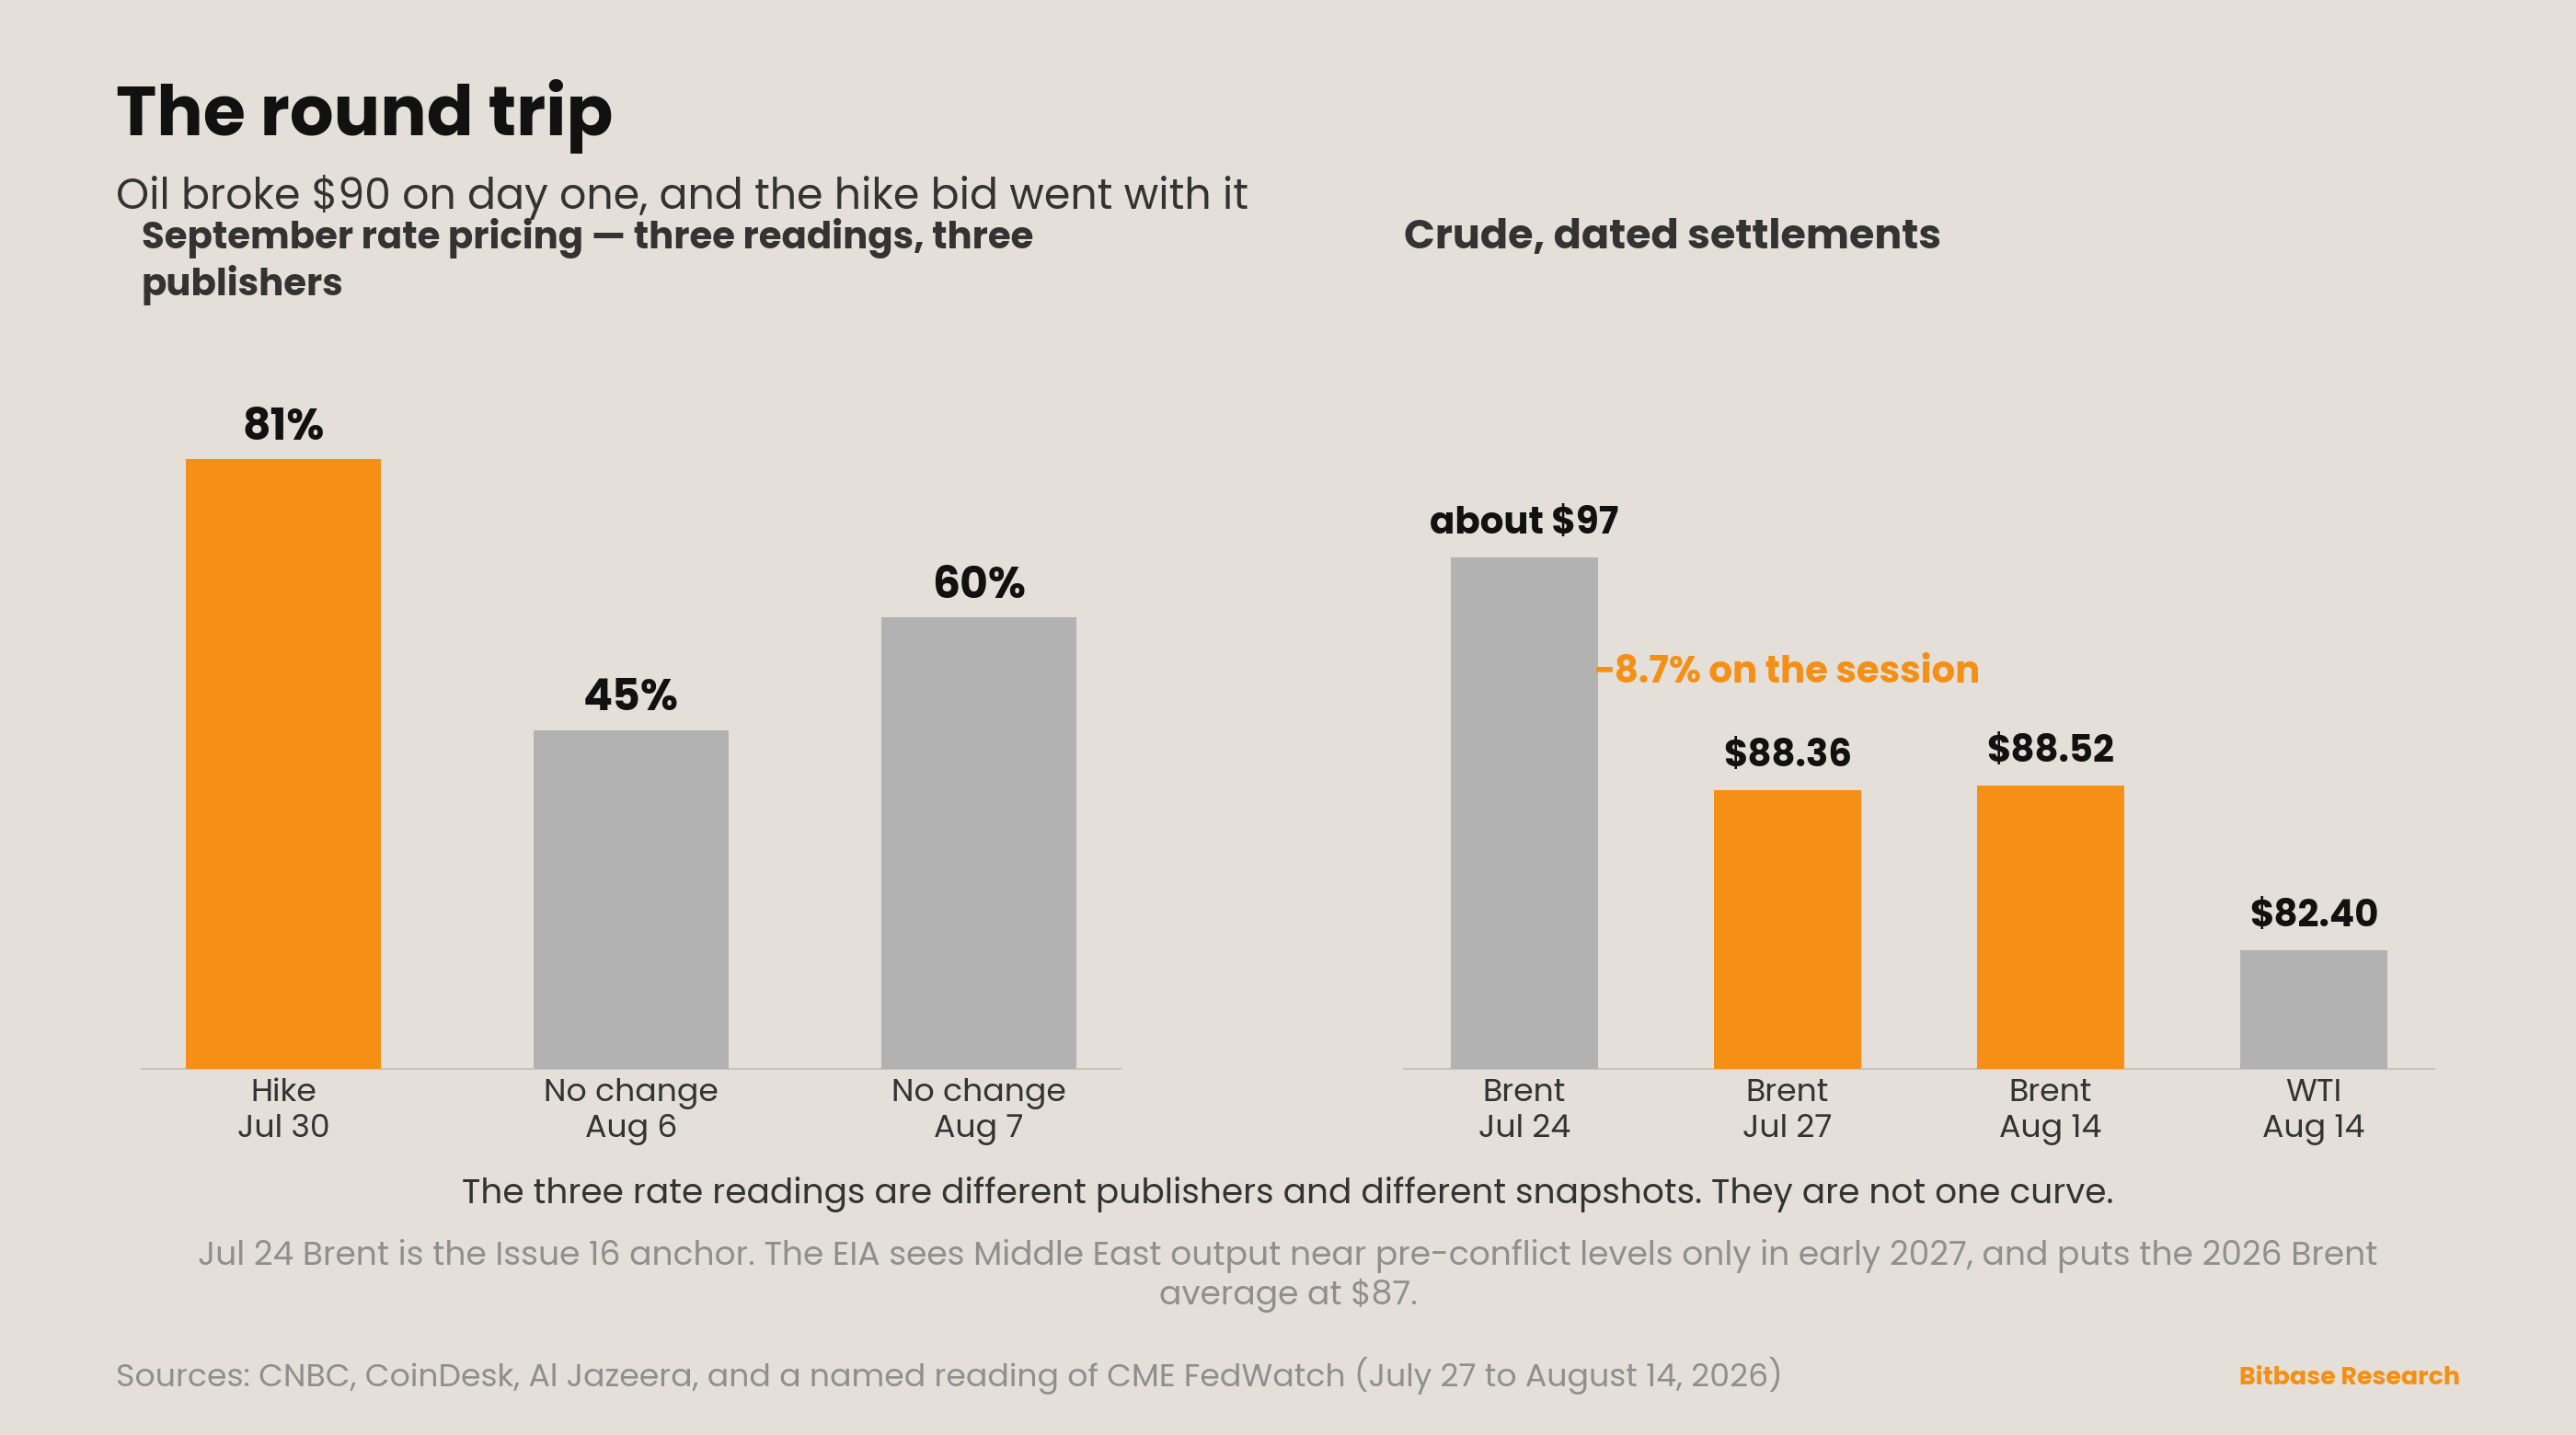
Issue 16 said everything in its first section was conditional on oil holding above $90. The condition failed inside twenty-four hours, in the helpful direction. On July 27 the September Brent contract shed 8.7% to close at $88.36, on nothing more than a report that Tehran would suspend attacks if Washington refrained from striking [1]. WTI gapped roughly 5% lower to about $85 [2]. Issue 16 had written that a Hormuz reopening would restore the June disinflation mechanism as fast as its closure removed it. It turned out not to need a reopening: the possibility of one was worth 8.7% in a session.
The rest of the window gave that gift back slowly. On August 12 attacks on Middle East shipping dented the prospects for a negotiated reopening and Brent rose more than 2% overnight, back near $90 [13]. On August 14 the US threatened Iran with "economic isolation" and Brent added 1.7% to $88.52 while WTI settled at $82.40 [3]. The EIA does not expect Middle East production near pre-conflict levels until early 2027 and puts its 2026 Brent average at $87 [14].
The rates leg ran the same round trip with a lag and a different trigger. Around July 30, CME FedWatch was read as pricing an 81% chance of a September hike [15]. By August 7 the odds of no change had moved to 60%, from 45% the day before, on a different publisher's reading [5]. What moved between them was not oil but labour: payrolls fell 23,000 in July against a Wall Street Journal consensus of +83,000, with average hourly earnings slowing to 3.2% [5][6].
The honest verdict on Issue 16's arithmetic is that the question never got asked. It wrote that if oil held near late-July levels, the component that supplied June's undershoot would supply the overshoot instead. Oil did not hold. July CPI, released August 12, showed energy falling another 1.5% on the month after June's 5.7% decline, with headline up 0.1% on the month and 3.4% on the year, and core up 0.2% and 2.5% [16][17]. The energy base effect is still ugly at +14.7% year over year, but the monthly impulse went the other way [17]. That was a conditional, not a forecast, and the condition failed.
This week's structural signal
The chain ran backwards through two links and then stopped.
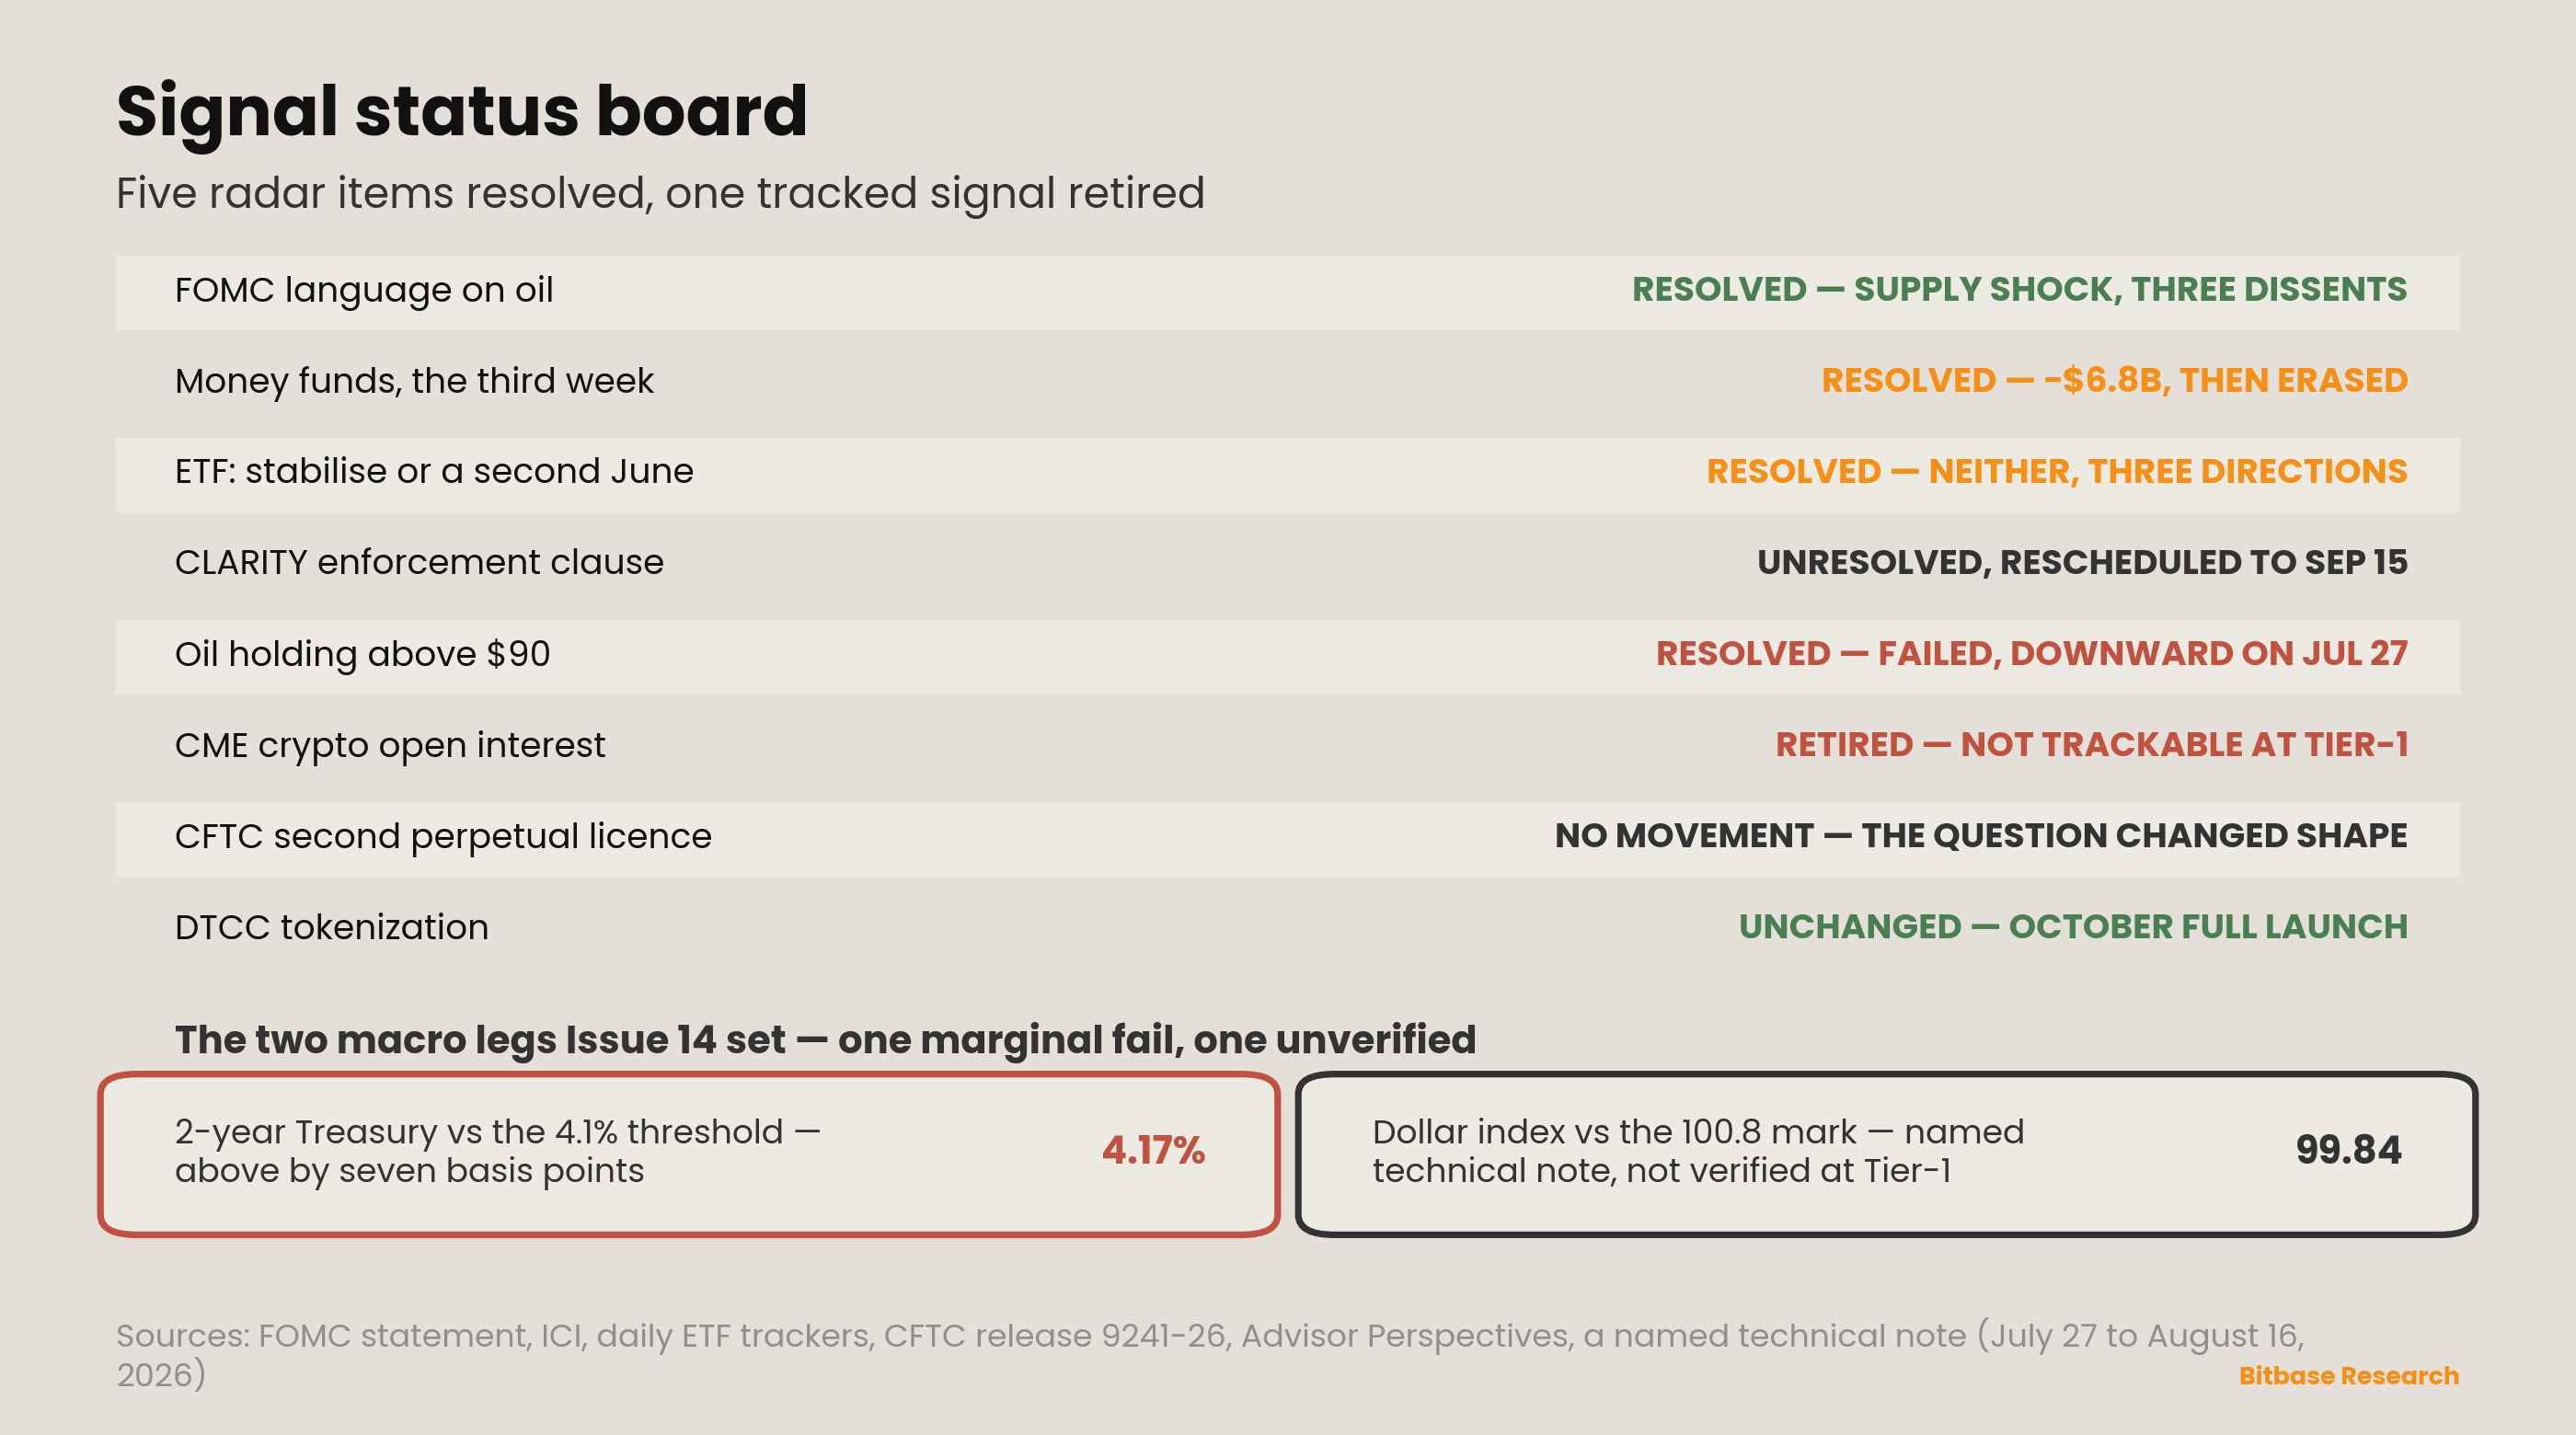
Issue 14 set two thresholds and Issue 16 reported both on the wrong side. This window moves one and leaves the other unverifiable. The two-year ended August 14 at 4.17% against a 4.1% marker—still above, but by seven basis points, which returns it to Issue 15's "scraping under" character rather than Issue 16's clear failure [7]. The dollar index looks to have turned on the readings available: the best one puts it near 99.84 on August 14 against a 100.8 marker [8]. That reading is a named technical note rather than an exchange settlement, and this issue could not verify it at Tier-1, so no pass is recorded against the threshold. The two macro legs stand at one marginal fail and one unverified.
And bitcoin fell anyway. BTC opened the window at $65,333.12 on July 27, with ether up more than 3% to near $1,950 [2][11]. On August 14 BTC opened at $63,418.16 and ether at $1,884.42 [12]. That is roughly −2.9% for BTC and −3.4% for ether, on our own arithmetic.
This is the finding worth keeping, and it does not rest on the dollar. Issue 16's causal claim was that when the front end reprices hawkish, the wrapper bid is the first thing to go. The three weeks that followed reversed oil and reversed the front end—both on dated Tier-1 readings—and the wrapper bid did not reliably respond. It surged, then it left. A relationship that only works in one direction is not a transmission channel; it is a coincidence with good timing. The series should hold that against its own previous issue, not against the market.
Dual-track scoreboard
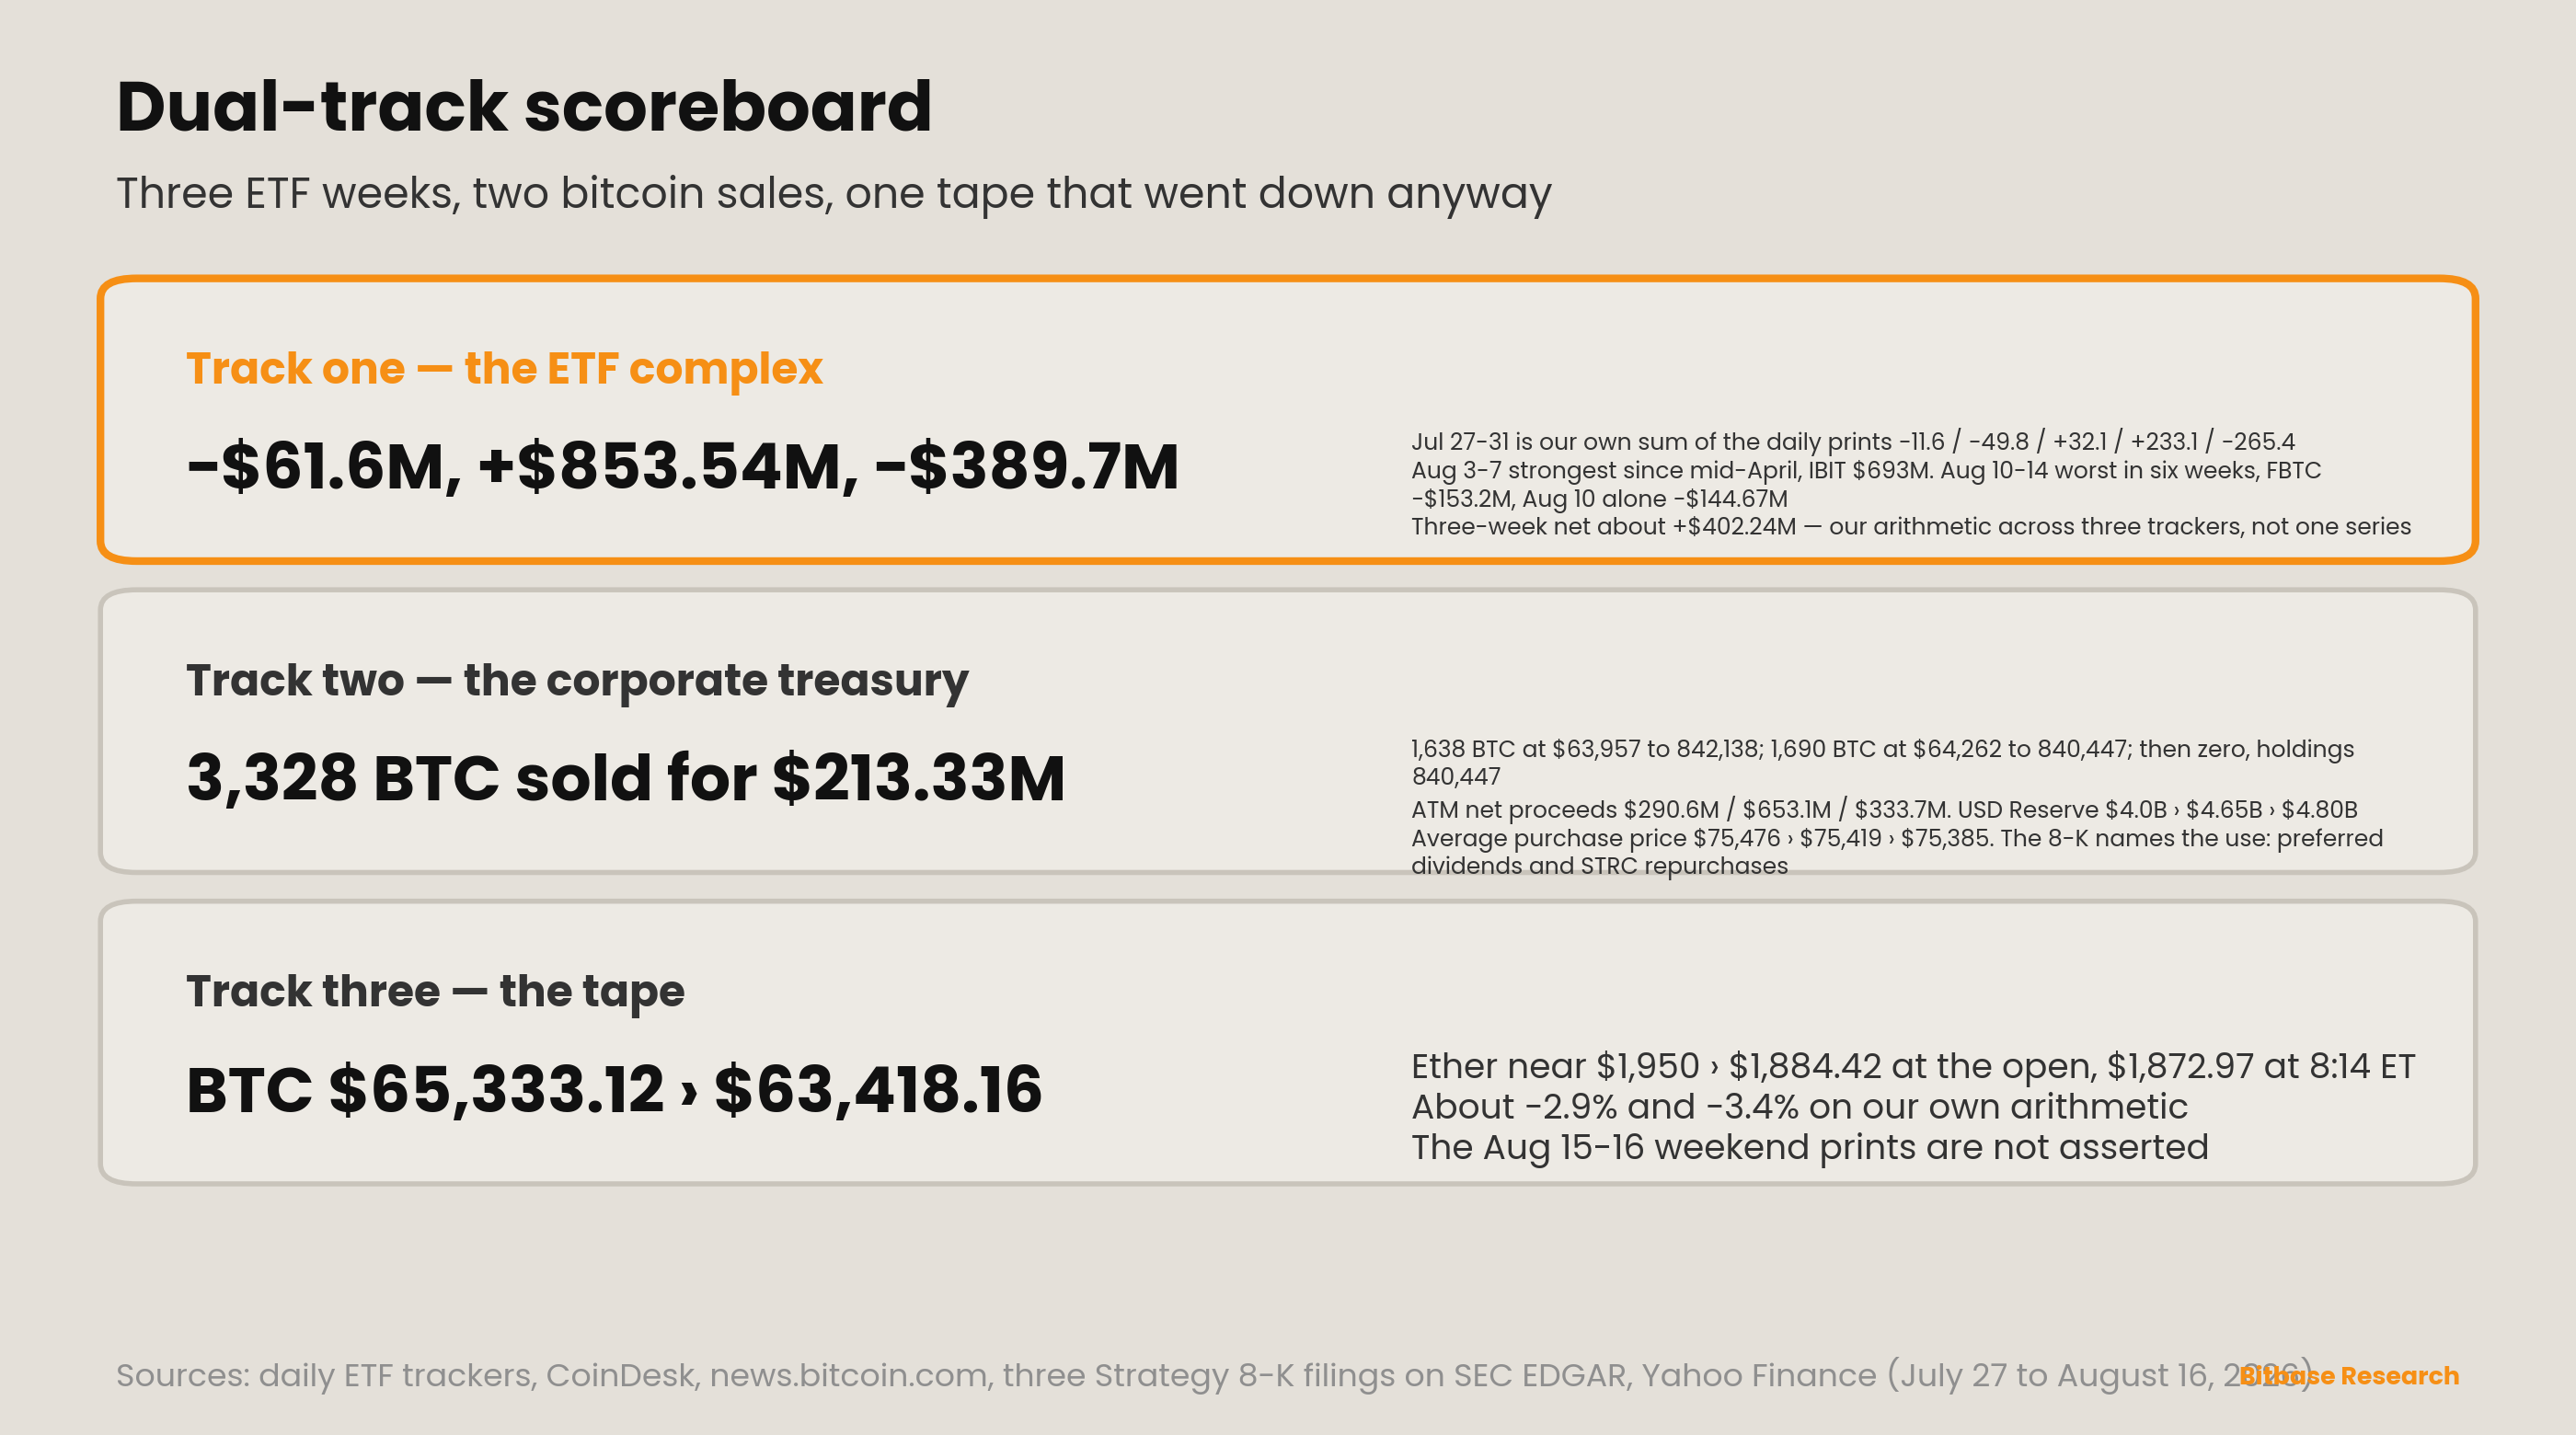
Track one—the ETF complex answered Issue 16's question by refusing both options. Issue 16 asked whether the record IBIT outflow was a two-day repricing or the start of a second June. It was neither. The five sessions of July 27 to 31 summed to about −$61.6 million, our own arithmetic from daily prints [18]. The week of August 3 to 7 then took in $853.54 million, the strongest since mid-April, with BlackRock's IBIT accounting for $693 million [19]. The week of August 10 to 14 gave back $389.7 million, the largest weekly outflow in six weeks, with Fidelity's FBTC losing $153.2 million [20]. Net across three weeks, roughly +$402 million. The strongest week since April and the weakest week in six sat inside the same three-week window, and the weak one came directly after a soft CPI.
Track two—the corporate treasury did the thing this series said it would not. Issue 15 judged Strategy's late-June sale of 3,588 BTC event-driven rather than a policy shift, and Issue 16 repeated that read. The 8-K for July 27 to August 2 reports 1,638 BTC sold at an average of $63,957; the one for August 3 to 9 reports 1,690 BTC sold at $64,262, taking holdings to 840,447; the one for August 10 to 16, filed August 17, reports no purchases or sales [21][22][23].
What overturns the earlier read is not the size but the stated use. The first filing says $52.4 million of the bitcoin proceeds funded preferred dividends and $52.3 million funded repurchases of STRC stock under the Digital Credit Securities Repurchase Program; the second says the net proceeds funded STRC repurchases too [21][22]. That is the liability side consuming the asset side on a named, recurring programme. Across the three weeks: 3,328 BTC sold for $213.33 million, the USD Reserve from $3.225 billion to $4.80 billion, and the preferred repurchase authorisation drawn down to $653.0 million of remaining capacity [21][22][23]. Two consecutive weeks of selling, with the proceeds earmarked in the filing, is a policy, not an event.
Track three—the tape. BTC slid into the FOMC, faded at month-end on July 31 as equities rallied, and left the window lower [11][12][24][25]. Ether held near $1,885 against resistance at $1,950 to $2,000 [26].
On the radar—week of August 17 to August 23
The calendar narrows to one week, and the interesting items are the ones this window left half-finished.
First, does the ETF complex confirm the mid-August outflow or reverse it again? Three weeks produced three directions, so a fourth reading is worth more than usual. Watch whether IBIT and FBTC move together: rotating concentration behaves differently from concentration that sits in one issuer.
Second, does Strategy resume selling or stay flat? The August 10 to 16 filing was flat, which by itself proves nothing—Issue 16 read two flat weeks as confirmation and was wrong. The test is whether the preferred dividend and STRC repurchase obligations get met from equity alone or from bitcoin again. The USD Reserve at $4.80 billion and $653.0 million of remaining repurchase authorisation are the two numbers that decide it.
Third, do money funds set a new record? Assets closed at $7.93 trillion, roughly $22 billion below the $7.95 trillion Issue 16 reported as the high. Two more weeks like the last two would take the series through it, retiring the inflection-point framing rather than merely downgrading it.
Fourth, the CLARITY Act between recess and the September 15 cloture vote. Nothing procedural can happen this week, which makes it the week when the enforcement text either gets negotiated privately or does not. Watch for any sign the White House has moved on state attorneys general.
Fifth, does oil stay in the $85 to $90 band? Both the disinflation and the front-end rally are built on it. A break above $90 restores the Issue 16 mechanism; a break below $85 makes the September pricing look conservative rather than dovish.
Signal tracking update
SIGNAL — Deep Dive 1 Part 1: "MMF asset scale inflection point." STATUS: THIRD DRAWDOWN ARRIVED AND WAS ERASED—the framing is downgraded.
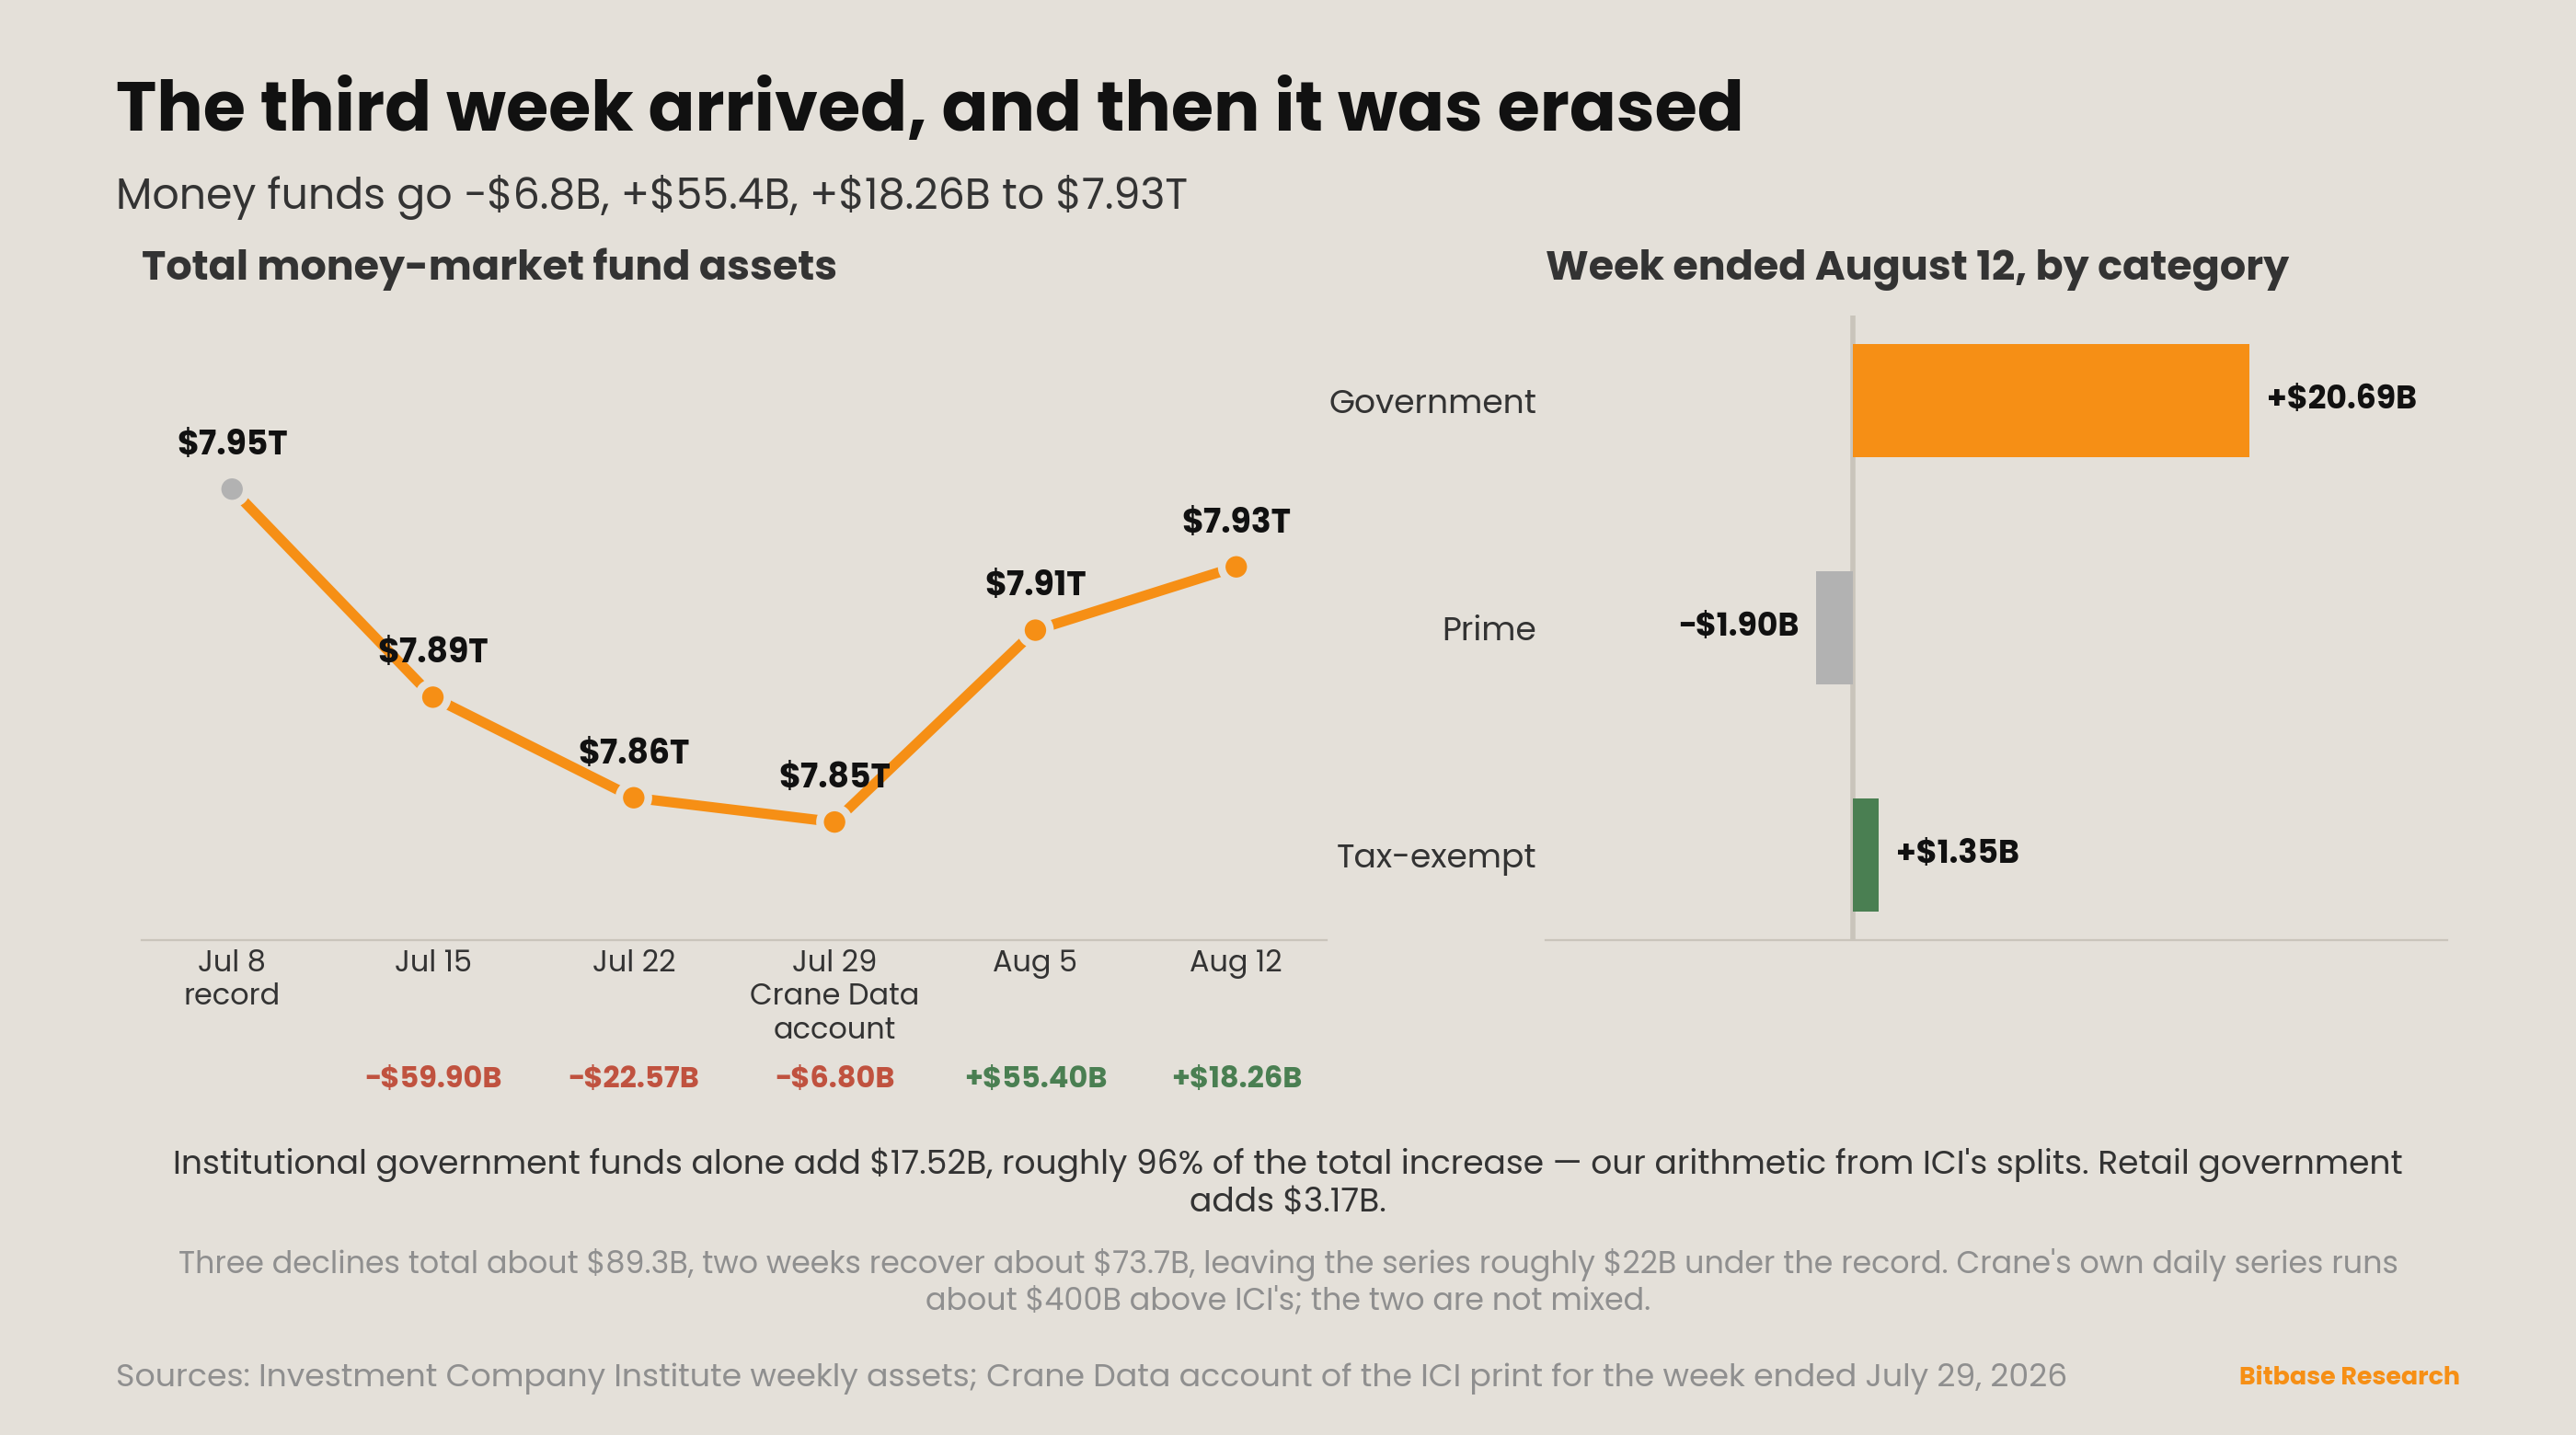
Issue 16 made the July 29 release the test of whether two consecutive prints were a series. The third print arrived and it was the smallest of the three: assets fell $6.8 billion in the week ended July 29. That one figure is carried at second hand: ICI's release page holds only the three most recent weeks, so it is Crane Data's account of the ICI print rather than an ICI publication read directly, and its category split is not asserted [10]. The two weeks that followed are first-hand: assets rose $55.4 billion to $7,909.32 billion, then $18.26 billion to $7,927.58 billion, on ICI's own table [9].
The composition settles it. In the week ended August 12, government funds rose $20.69 billion, of which institutional government funds alone accounted for $17.52 billion—roughly 96% of the increase, our arithmetic from ICI's splits and the exact mirror of Issue 16's figure on the way down [9]. So the technical condition for the inflection story was met and the story got weaker rather than stronger: three declines totalling about $89.3 billion, then two weeks recovering about $73.7 billion, leaving the series roughly $22 billion under its record. A category that supplies 96% of the fall and 96% of the rebound is doing cash management, not asset allocation.
SIGNAL — Deep Dive 1 Part 6: "Whether CME crypto-derivatives open interest persistently holds above $30 billion by 2027." STATUS: RETIRED—this series cannot track it at Tier-1, and closes it out rather than carrying it again.
The gap has been open since Issue 10; this is the seventh issue to report it. This round checked seven places: CME Group's Bitcoin Futures volume and open-interest page, its Bitcoin Friday Futures page, its daily exchange volume and open-interest page and its cryptocurrencies section, plus CryptoQuant's stacked CME open-interest series, The Block's CME trader-category breakdown and CoinGlass. None produced a named, dated dollar figure inside July 27 to August 16, so no number is given. The reason is structural: the exchange publishes open interest as live contract counts on rolling pages with no dated archive this method can cite, and the dashboards that convert them into dollars are live displays, not dated publications. A criterion that can only ever print "data gap" is not a test. It is a standing entry that teaches readers to skip the section. So it is retired here, in the open, rather than dropped quietly. It would reopen on a dated Tier-1 dollar reading, or on a replacement criterion built on CME's commitments-of-traders positioning, which is published on a dated schedule.
SIGNAL — Deep Dive 1 Part 6: "Whether the US CFTC approves more licensed entities to offer perpetual-swap-style products." STATUS: No movement in this window—but the question has changed shape.
Nothing new landed in the window. The verified record still runs to May 29, 2026, when the Commission approved KalshiEX LLC's BTCPERP contract and invited other designated contract markets to submit perpetuals voluntarily. The same day, the Market Participants Division told Coinbase Financial Markets that certain perpetuals on its affiliated foreign board of trade, Deribit FZE, may be categorised as foreign futures under Regulation 30.1, and took a no-action position on posting customer digital commodities and stablecoins with the foreign broker affiliate as margin [27]. Issue 16 framed the open question as second venue versus moat around the first mover. Both options assumed the only route was a domestic licence. There is a third: an offshore venue paired with a domestic broker, which serves the demand without ever producing a second name on the licence list. That is not an absence of progress but a change in the shape of the question, and it deserves a Deep Dive.
SIGNAL — Deep Dive 1 Parts 3 and 6: "Tokenized RWA as common collateral infrastructure." STATUS: Unchanged; October full launch still the date.
No new disclosure inside the window. DTCC's Tokenization Service is still set for full launch in October 2026, after a July 15 live run using DTC-custodied assets in real production trades [28]. The issue covering October should be its settlement, not another carry.
New dimension—the market-structure bill missed its window and got a date instead
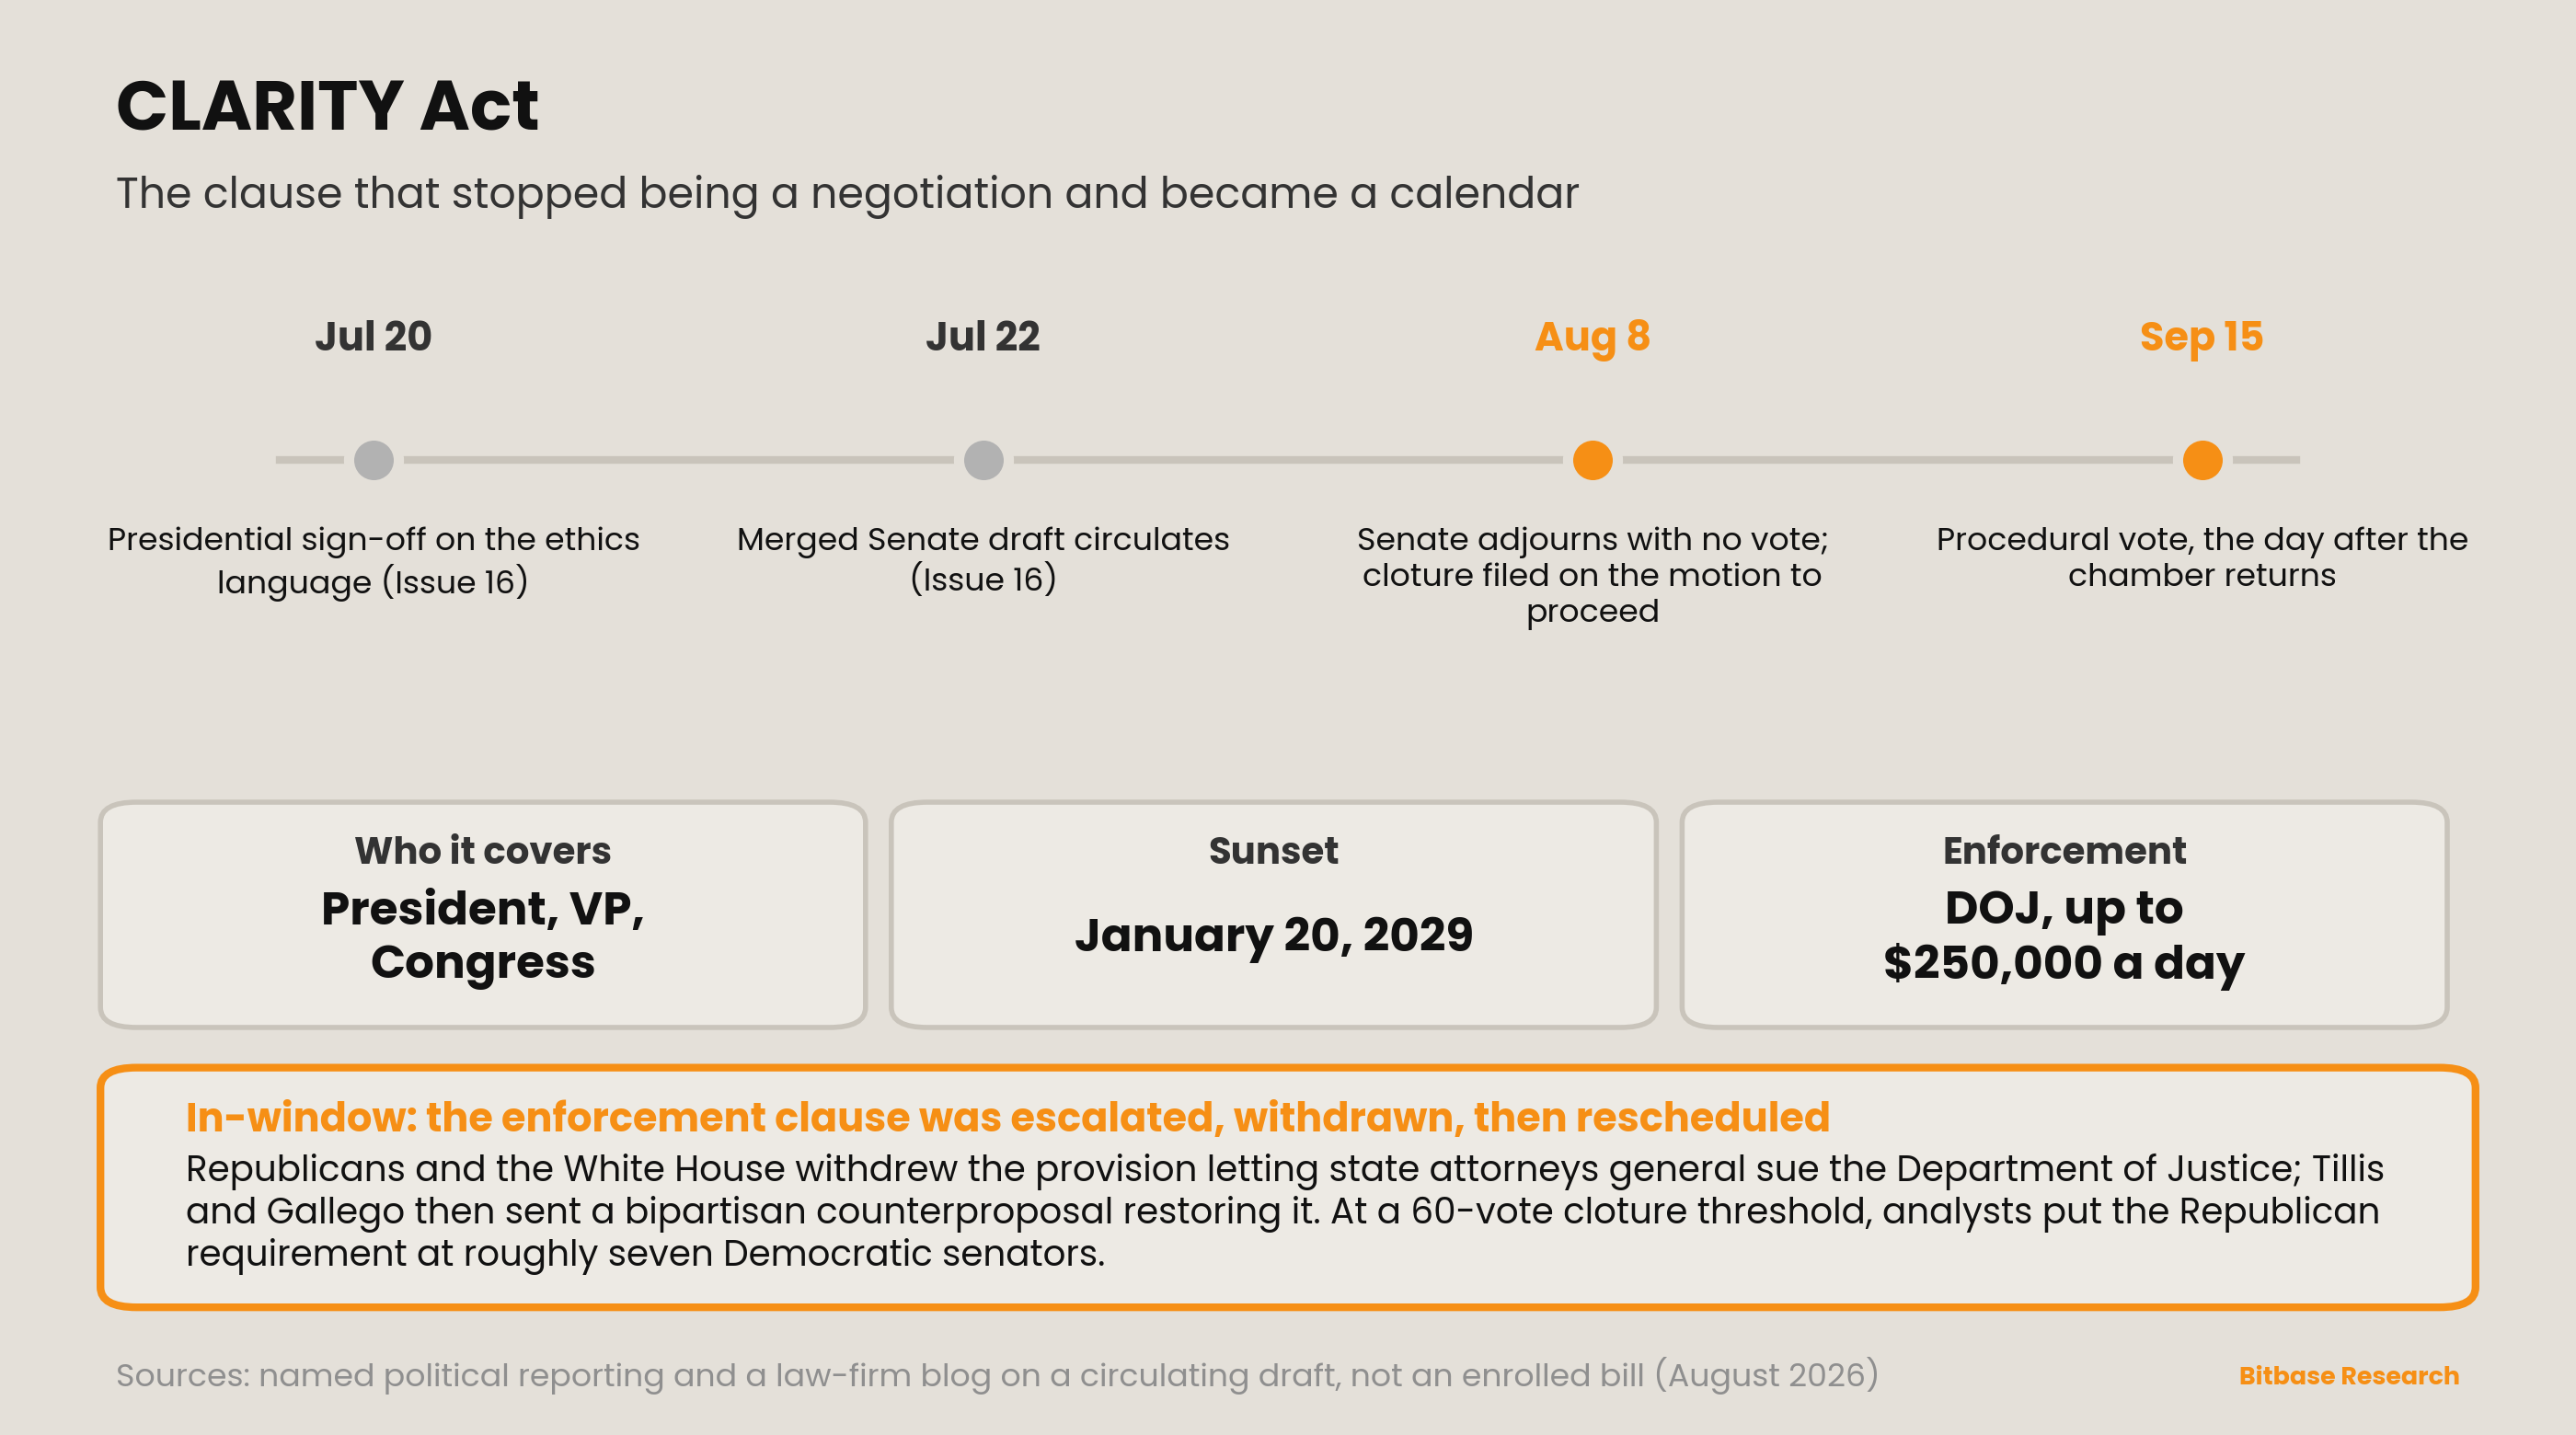
Issue 16 wrote that a single unresolved clause was what stood between the current draft and a floor vote. Three weeks later that sentence is still literally true, and the price of it has gone up. The enforcement question got escalated, then withdrawn, then rescheduled. A closed-door session involving key senators and White House Crypto Council executive director Patrick Witt collapsed after Republicans and the White House withdrew the provision that would have let state attorneys general sue the Department of Justice [29]. Senators Thom Tillis and Ruben Gallego then sent the White House a bipartisan ethics counterproposal that would allow state attorney general enforcement [29][30].
Neither move produced a vote. The Senate adjourned on August 8 without acting on the bill. Majority Leader John Thune then filed cloture on the motion to proceed, which sets a procedural vote for September 15, the day after the chamber returns [30]. The arithmetic behind the delay is unchanged: at a 60-vote cloture threshold, analysts put the Republican requirement at roughly seven Democratic senators, and the ethics text is what those seven are pricing [29]. The terms Issue 16 reported—coverage of the president, vice president and members of Congress, a January 20, 2029 sunset, and Department of Justice enforcement with fines up to $250,000 a day—are still on the table.
Every macro item in this window moved fast and moved back—oil, the front end and the money-fund series each made a round trip in three weeks. The one item that moved in only one direction is the legislative one, and the direction was backwards. A macro shock can be given and taken back inside fifteen sessions. A withdrawn enforcement provision costs a session of Congress. Regulatory progress remains the durable positive for the asset class. It is simply not available at this series' frequency.
Caveats
Date integrity. This issue's window is July 27 to August 16, 2026, three weeks rather than one, because the series paused after Issue 16 and this compilation covers the gap. The July 29 FOMC, the August 7 employment report, the August 8 adjournment, the August 12 CPI, the three ICI weeks, the ETF prints and the August 14 oil, yield and dollar readings all fall inside it. The Strategy 8-K covering August 10 to 16 was filed on August 17, one day after the window closed; the activity is in-window and the disclosure is not, and it is carried on that basis. The September 15 cloture vote, the DTCC October launch and the September FOMC are forward items; the ICI week ended August 19 is excluded.
Verification and attribution. This issue's knowledge cut-off precedes its entire window, so every figure was verified online in this round rather than recalled. Primary sources carry the FOMC statement and dissent list, the ICI asset table for August 5 and 12, the three Strategy 8-Ks, and the CFTC release. The BLS employment and CPI releases were located as primary documents, but their figures—like the oil settlements and EIA expectations—come through named wire reporting. Rate probabilities are third-party readings of CME FedWatch, not exchange publications. CLARITY Act developments are from a named law-firm blog and political reporting on a circulating draft rather than an enrolled bill, so the terms and the schedule may change.
Source-caliber flags. Three readings sit below Tier-1. First, the −$6.8 billion for the week ended July 29 is Crane Data's account of the ICI print, not an ICI release read directly: ICI's release page carries only the three most recent weeks, and neither its weekly-assets page nor Crane Data's archive surfaced the original, so its category split is not asserted [10]. Crane's own daily series runs roughly $400 billion above ICI's; the two are not mixed. Second, the dollar index is carried at 99.84 for August 14 from a named technical note rather than an exchange settlement, with a separate same-month note at 99.60; no threshold pass is recorded for the dollar leg, because neither reading could be verified at Tier-1 [8], and section 2's finding does not depend on it. Third, CME crypto open interest has no figure here at all, and the signal is retired in section 5 rather than carried, because the sources listed there cannot supply a dated Tier-1 dollar reading.
Data-caliber conflicts. Two readings of September rate pricing cannot be reconciled and are carried with their dates and publishers: an 81% hike probability around July 30, and a 60% no-change probability on August 7 against 45% the prior day [15][5]. Weekly ETF totals come from three trackers with different methodologies, remain subject to revision, and must not be read as one series; the −$61.6 million and +$402 million figures are our own sums [18][19][20]. One promotional aggregator asserted zero net-outflow days for spot bitcoin ETFs in August 2026; the −$144.67 million print for August 10 contradicts it, so it is not used. The 96% share is arithmetic from ICI's splits, not a stated ICI finding [9]. No Hormuz transit count, weekend print, or implied August 14 ETF flow is asserted.
Causation discipline. The central claim—that oil and the front end round-tripped while the wrapper bid did not follow—is a reading of sequence, not a forecast, and the ETF series it rests on is the least reliable here. Reading Strategy's sales as policy rests on the stated use of proceeds in its filings, which is disclosure of purpose rather than intent. Three of this series' own judgements are corrected here: the money-fund inflection framing is downgraded, the event-driven reading of Strategy's June sale is withdrawn, and the CME open-interest criterion is retired as untrackable. Nothing here is investment advice.
Related reading
Other Bitbase articles on this topic:
Disclaimer: This article is market commentary from Bitbase Research, provided for information only. The views are those of Bitbase Research as of the date of writing and do not constitute investment, trading, tax, or financial advice, nor an offer or solicitation to trade. Data in this issue is current as of August 16, 2026; markets and disclosures may change, so refer to the latest information from authoritative sources. Trading crypto assets and leveraged products carries significant risk, including the possible loss of your capital.
References
[1] Oil prices slide, Brent crude below $90 as the U.S.-Iran pause holds, July 27, 2026. cnbc.com
[2] Bitcoin is back above $65,000 as U.S.-Iran hold fire and oil drops 5%, July 27, 2026. coindesk.com
[3] Oil prices rise as U.S. threatens economic isolation of Iran, August 14, 2026. cnbc.com
[4] Federal Reserve issues FOMC statement, July 29, 2026. federalreserve.gov
[5] Odds the Fed will hike in September tumble following big July jobs miss, August 7, 2026. cnbc.com
[6] Jobs report July 2026: payrolls fell 23,000, August 7, 2026. cnbc.com
[7] Treasury yields snapshot, August 14, 2026. advisorperspectives.com
[8] U.S. Dollar Index technical analysis, August 14, 2026. blog.oneuptrader.com
[9] Investment Company Institute, weekly money-market fund assets, weeks ended August 5 and 12, 2026. ici.org
[10] ICI: MMF assets up again in August, August 2026. cranedata.com
[11] Bitcoin and ethereum prices today, Monday, July 27, 2026. finance.yahoo.com
[12] Bitcoin and ethereum prices today, Friday, August 14, 2026. finance.yahoo.com
[13] Oil prices rise as attacks dent hopes for Strait of Hormuz reopening, August 12, 2026. aljazeera.com
[14] Hormuz deadlock: oil price outlook as the U.S.-Iran standoff drags on, August 11, 2026. cnbc.com
[15] CME FedWatch signals high odds of a September rate hike, July 30, 2026. southeastagnet.com
[16] CPI inflation report July 2026, August 12, 2026. cnbc.com
[17] Here's the inflation breakdown for July 2026 CPI in one chart, August 12, 2026. cnbc.com
[18] Bitcoin ETF flows, live daily tracker, July 27 to July 31, 2026. tftc.io
[19] Bitcoin investors pour $853 million into spot ETFs and BlackRock's IBIT claims the bulk, August 9, 2026. coindesk.com
[20] Fidelity leads a $389.7M bitcoin ETF weekly outflow with a $153M exit, August 2026. news.bitcoin.com
[21] Strategy Inc, Form 8-K for July 27 to August 2, 2026, filed August 3, 2026. sec.gov
[22] Strategy Inc, Form 8-K for August 3 to August 9, 2026, filed August 10, 2026. sec.gov
[23] Strategy Inc, Form 8-K for August 10 to August 16, 2026, filed August 17, 2026. sec.gov
[24] Bitcoin and ethereum prices today, Tuesday, July 28, 2026. finance.yahoo.com
[25] Bitcoin and ether fall as equities rally, July 31, 2026. coindesk.com
[26] Weekly crypto report, August 14, 2026. zebpay.com
[27] Commission staff confirms the categorization of certain crypto asset perpetuals as foreign futures, release 9241-26, May 29, 2026. cftc.gov
[28] DTCC sets an October launch for its tokenized securities platform, 2026. coindesk.com
[29] CLARITY Act delay: ethics deadlock kills the Senate's last 2026 window, August 2026. yahoo.com
[30] Senate adjourns without a CLARITY Act vote, September vote now on the calendar, August 2026. troutmanfinancialservices.com