
A golden cross usually refers to a shorter moving average crossing above a longer one, while a death cross refers to the shorter average dropping below the longer one. The best known pairing is the 50-period and the 200-period average, but it is not the only period combination in use.
How a crossover works
A crossover system uses two moving averages of different lengths: a shorter, faster one that reacts quickly, and a longer, slower one that shows the broader trend. As long as the fast line stays above the slow line, the shorter-term momentum is stronger than the longer-term average, a broadly bullish condition. When the fast line crosses to the other side, it signals that the balance of momentum has shifted, which traders treat as a potential trade signal.
The golden cross
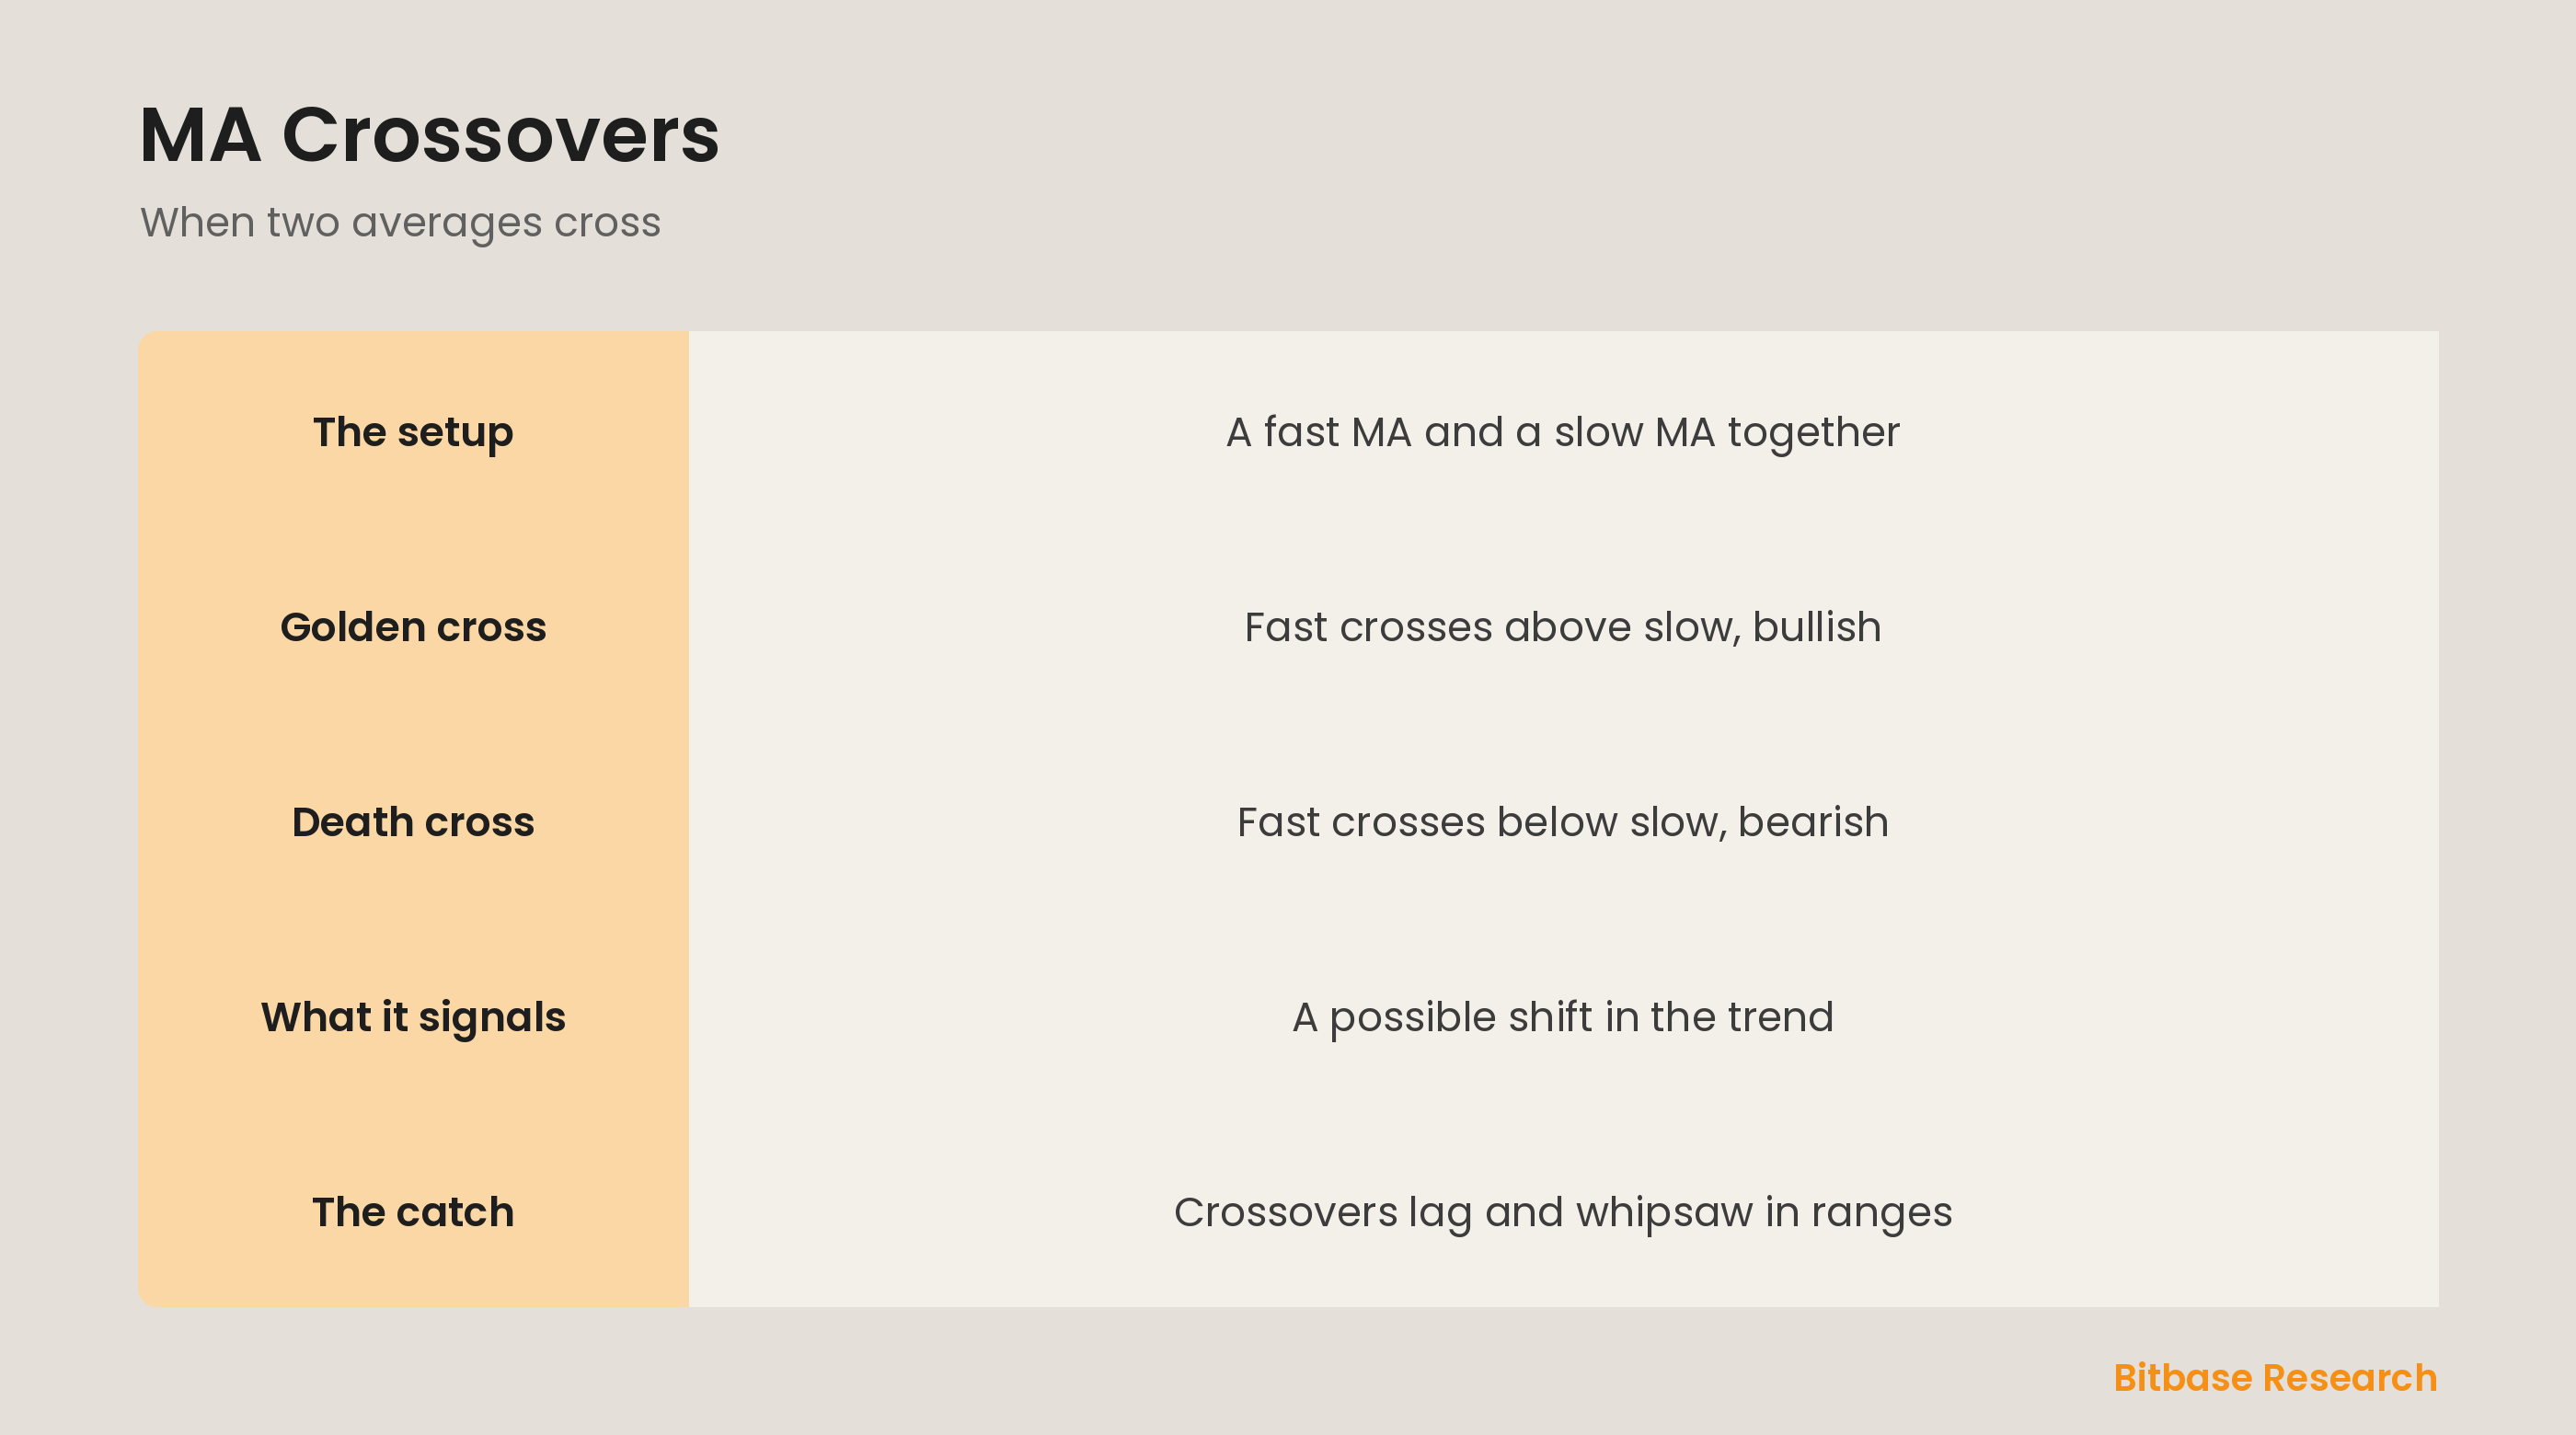
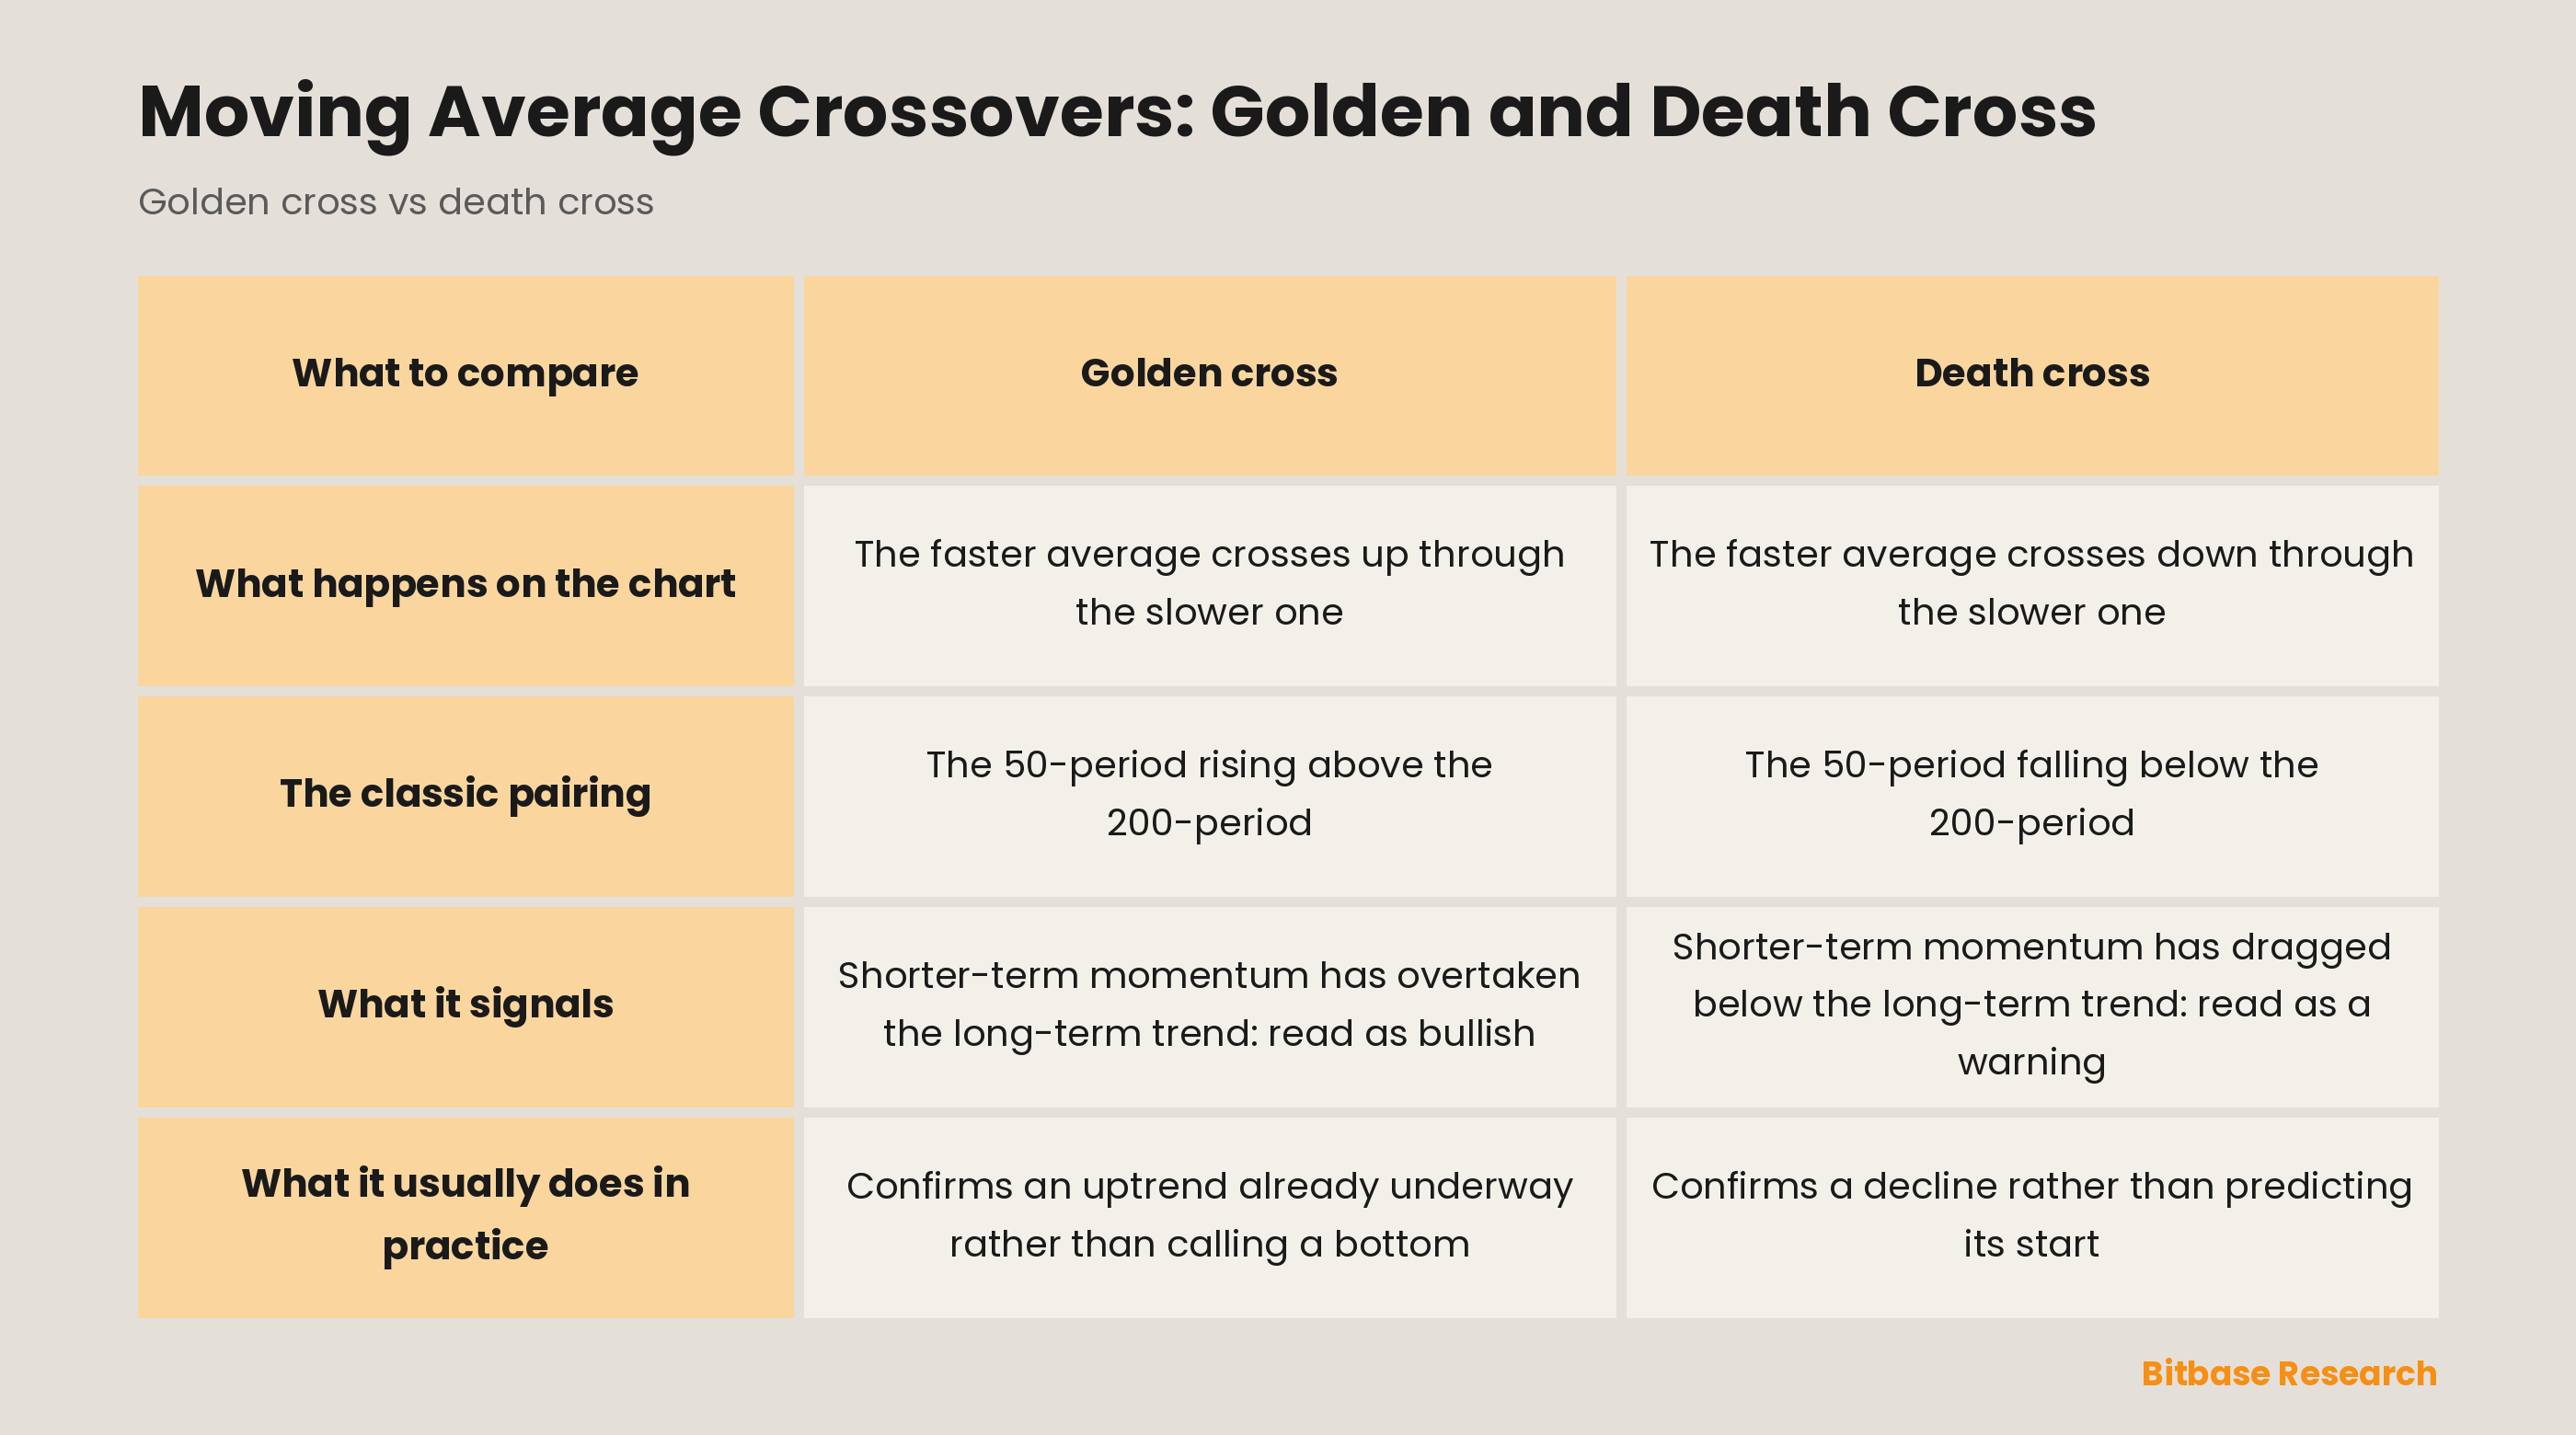
A golden cross happens when a faster moving average crosses up through a slower one, classically the 50-period rising above the 200-period. It signals that shorter-term momentum has turned up strongly enough to overtake the long-term trend, and it is widely read as a bullish sign that a major uptrend may be beginning. Because it involves long averages, a golden cross is a slow, big-picture signal, often confirming a trend that is already underway rather than calling a bottom.
The death cross
A death cross is the bearish opposite: a faster moving average crossing down through a slower one, classically the 50-period falling below the 200-period. It signals that shorter-term momentum has turned down enough to drag below the long-term trend, and it is read as a warning that a major downtrend may be setting in. Like the golden cross, it is a slow signal built from long averages, so it tends to confirm a decline rather than predict its start.
The limits of crossovers
Crossovers have a real weakness: they lag. Because they are built from averages of past prices, the cross only happens after a move is well underway, so you get in or out late. Worse, in a sideways, choppy market, the two averages cross back and forth repeatedly, generating a string of false signals called whipsaws that can rack up losses. Crossovers work best in strongly trending markets and poorly in ranging ones, so context and confirmation still matter.
The 50 and 200 periods are not the only standard
Traders also use other period combinations, some shorter and some longer than the classic pair. A different pair changes both how fast the signal arrives and how often it turns out to be false.
Golden cross vs death cross
The bottom line
A moving average crossover uses a fast and a slow average, signaling a shift when the fast one crosses the slow one. A golden cross, fast crossing above slow, is bullish, while a death cross, fast crossing below, is bearish, both famous when built from the 50 and 200 periods. But crossovers lag because they rely on past prices, and they whipsaw in ranging markets, so they work best in strong trends and should be paired with other confirmation. To keep learning the fundamentals, follow more from Bitbase Academy.
Frequently asked questions
Does a golden cross always mean price will rise?
No. A golden cross is a slow signal built from long averages, so it more often confirms an uptrend already underway than calls a bottom. In a sideways, choppy market the two averages cross back and forth repeatedly, producing a string of false signals.
Does a death cross always mean a bear market?
No, for the same reason. A death cross is read as a warning that a major downtrend may be setting in, but it relies on past prices, so it tends to confirm a decline rather than predict its start.
Why are the 50 and 200 periods so commonly used?
Because that pairing is the best known one: a faster average against a slower one, both long enough that the signal is slow and big-picture. It is not the only combination in use, though, and traders also run 20/50, 50/100 or other period pairs.
Can both SMA and EMA be used for crossovers?
A crossover system only needs a faster average and a slower one, so either type works. The choice changes how quickly the cross appears and how often it turns out to be false, which is the same trade-off between speed and steadiness that runs through moving averages generally.
Related reading
Other Bitbase articles on this topic:
- SMA vs EMA: Which Moving Average to Use
- CCI and Williams Percent R Indicators
- The MACD Indicator Explained
Disclaimer: This article is educational content from Bitbase Academy, provided for information only. It does not constitute investment, trading, tax, or financial advice. Crypto assets are volatile; assess your own risk. Written as of June 2026; refer to the latest official information.
References
[1] Investopedia, "Golden Cross Pattern: Definition and Example" investopedia.com
[2] Investopedia, "Death Cross: Definition, How It Works, and Examples" investopedia.com
[3] Investopedia, "Moving Average (MA): Purpose, Uses, Formula, and Examples" investopedia.com