
Divide what a network is worth by the value it settles on-chain in a day and you have the NVT ratio. The arithmetic takes one line. Everything that decides whether the result means anything happens in the two numbers you feed it, and the harder of the two is the denominator.
What the ratio divides
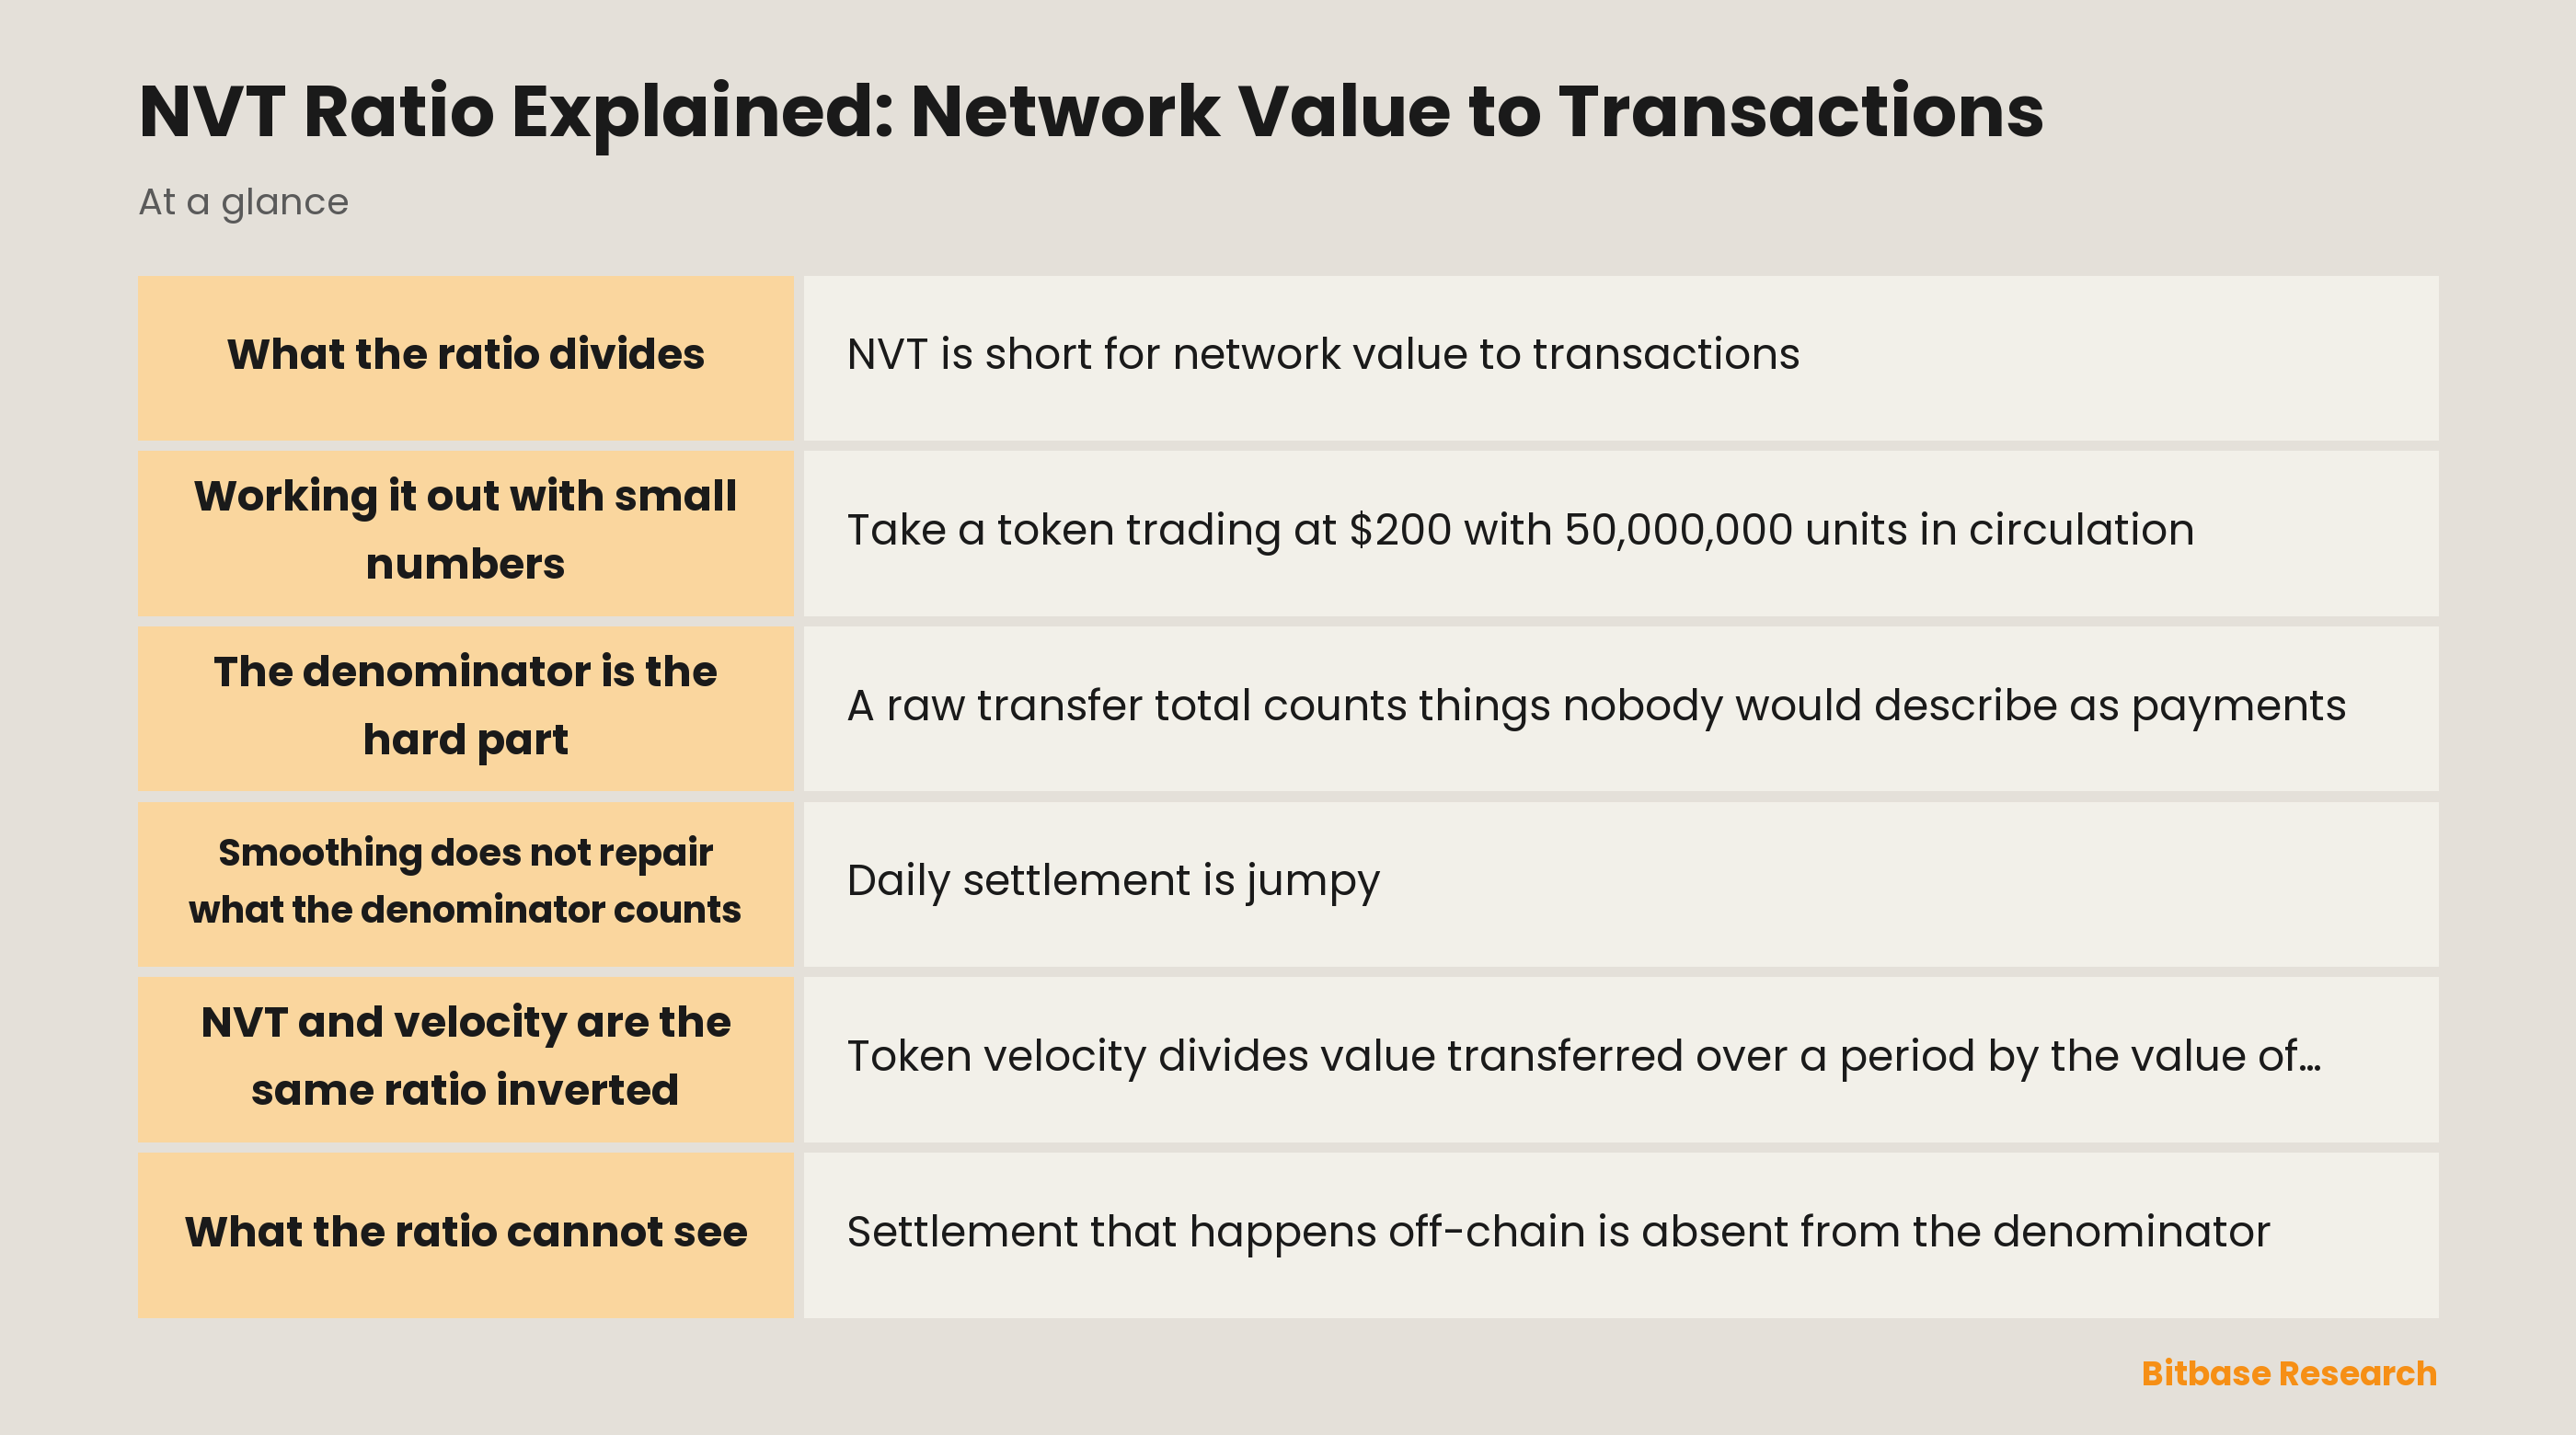
NVT is short for network value to transactions. The numerator is network value: price multiplied by circulating supply, the same quantity as crypto market cap. The denominator is the value of transactions the chain settled over a chosen period, priced in the same currency. This article fixes that period at one day.
The shape is borrowed from equity analysis, where a number describing price sits on top of a number describing activity. What the division returns is a duration. If network value is forty times one day of settlement, the network is worth forty days of its own throughput at that day's rate.
What the ratio excludes is as fixed as what it includes. It carries no view on growth, on security spending, on who holds the supply or on what happens when incentives stop. A high reading says that price is large relative to one measured flow, and the reason it is large is exactly the thing the ratio does not report.
Working it out with small numbers
Take a token trading at $200 with 50,000,000 units in circulation. Network value is $10,000,000,000. On the day in question the chain settles $250,000,000 of transfers. Divide, and NVT is 40.
Read that back in the units it came from. Forty days of settlement at that day's rate would move value equal to the whole network. Nothing in the number says whether forty is high, and nothing in it says which half produced the reading.
Both halves move, and the ratio cannot separate them. It rises when price rises against flat settlement, and it rises when settlement falls against a flat price. Those are different events with the same printout, and anyone quoting the level at you has the same problem.
The denominator is the hard part
A raw transfer total counts things nobody would describe as payments. Change returns to the sender and is counted. A wallet consolidating its own funds is counted. An exchange moving balances between its own addresses is counted. None of these transfer value between two parties, and all of them inflate the same figure.
Coin Metrics maintains an adjusted transfer value for this reason. It discounts outputs paid back to an address that was also an input, drops outputs spent within an hour of being created, and strips shuffles between an entity's own wallets. The adjusted series and the raw series answer different questions, and only one of them is about payments.
Run the same day through the adjusted lens. Suppose 60% of that raw total is self-transfer of the kinds above. Adjusted settlement is $100,000,000 and NVT becomes 100. Same chain, same day, same price, and the reading has more than doubled because the recipe changed.
That is the practical rule for the whole metric. A reading travels with its recipe or it means nothing: state which transfer series and which supply series went in, keep the recipe fixed, and never compare a number built one way against a number built another.
Smoothing does not repair what the denominator counts
Daily settlement is jumpy. One large transfer between two custodians can dominate a day, which makes a single day's NVT a noisy reading of anything slower than a day. One repair is to average the denominator over a window of days instead of taking one day raw, and that is where the smoothed variants of the ratio come from.
Smoothing does exactly one thing: it removes single-day noise. It does not remove change outputs, self-consolidation or cold-wallet shuffles, because averaging a mis-measured series returns a smoother mis-measured series. Adjust first, then smooth. Doing it in the other order hides the problem instead of fixing it.
NVT and velocity are the same ratio inverted
Token velocity divides value transferred over a period by the value of circulating supply. NVT divides those two the other way up. They are reciprocals, so every objection to one is an objection to the other, and a claim that velocity is rising is the same claim as NVT falling.
The monetary statistics behind velocity make the same point about where the number comes from. The Federal Reserve Bank of St. Louis publishes velocity as the frequency at which one unit of currency is used to buy goods and services in a period, calculated as nominal output divided by the money stock. It is derived from two other series rather than observed, and so is NVT.
What the ratio cannot see
Settlement that happens off-chain is absent from the denominator, and the ratio reads as though it never happened. The Bank for International Settlements notes that centralised exchanges keep their order books off-chain, as traditional venues do, and lists the large number of off-chain transactions among the reasons basic crypto figures lack transparency and consistency. When two customers of one venue trade with each other, balances move inside a database and the chain records nothing.
Activity that settles on another layer and returns only a compressed record to the base chain has the same effect from the other direction. The value moved is real, the denominator sees a fraction of it, and NVT rises without anything happening to usage.
The denominator also counts value moved rather than value used. A transfer to a custodian, a payment for a service and a rebalancing between two of your own accounts enter the total identically, and no adjustment recovers intent from a ledger entry.
There is a mismatch between the two halves worth checking before you quote a number. The numerator prices one asset, the native one. The denominator can be dominated by transfers of stablecoins and other tokens the numerator does not price at all. Where that is true, the ratio divides one asset's value by a different set of assets' throughput, and the result is not a valuation of anything.
Reading a number with no natural scale
There is no level at which NVT is correct, and none at which it is expensive. Comparing two assets by their NVT imports both counting conventions along with the numbers, and the difference between the readings may be entirely a difference in what each series adjusts for. The defensible comparison is an asset against its own history on a fixed recipe.
It also helps to know which question each on-chain ratio is answering, because they are not variations on one measure. MVRV compares price to what the market paid, NVT compares price to throughput, and fee-based valuation multiples compare price to revenue the protocol actually collected.
| Ratio | What sits on top | What sits underneath | What it is blind to |
|---|---|---|---|
| NVT | Network value | On-chain settled value | Off-chain and netted activity |
| Velocity | On-chain settled value | Network value | The same, inverted |
| MVRV | Network value | Aggregate cost basis | Activity of any kind |
| Price to fees | Network value or FDV | Fees paid by users | Value that pays no fee |
Read alongside the rest of on-chain analysis, NVT earns its place as one input among several. Read alone, as a level with a threshold attached, it can stay misleading for long stretches.
The bottom line
NVT puts network value over on-chain settled value, and the answer is a duration rather than a verdict. The numerator is easy and the denominator is not: raw transfer totals include change, consolidation and internal shuffles, so an adjusted series and a raw series produce readings that differ by more than the gap between two assets. Smoothing removes noise and nothing else. Off-chain trading, netted layers and token transfers the numerator never prices all sit outside the measurement. Quote the ratio with its recipe attached, compare an asset with itself, and treat the level as a question rather than an answer. To keep learning the fundamentals, follow more from Bitbase Academy.
Related reading
Other Bitbase articles on this topic:
- Network Congestion Indicators and What Each One Measures
- NFT Wash Trading Warning Signs Explained
- The SOPR Indicator Explained
- Hammer and Shooting Star Candlesticks
Disclaimer: This article is educational content from Bitbase Academy, provided for information only. It does not constitute investment, trading, tax, or financial advice. Crypto assets are volatile; assess your own risk. Written as of September 2026; refer to the latest official information.
References
[1] Coin Metrics Data Encyclopedia, Transfer Value (Adjusted Transfer Value) coinmetrics.io
[2] Velocity of M2 Money Stock (M2V), FRED, Federal Reserve Bank of St. Louis fred.stlouisfed.org
[3] Bank for International Settlements, The crypto ecosystem: key elements and risks bis.org