
Every coin that moves on a public chain carries a record of the price it last moved at. Compare that to the price it is moving at now and you know whether whoever is spending it is ahead or behind. SOPR is that comparison, aggregated across every coin that moved in a period, and it is one of the few market readings built from outcomes that have already happened rather than from opinion about what comes next.
What SOPR measures
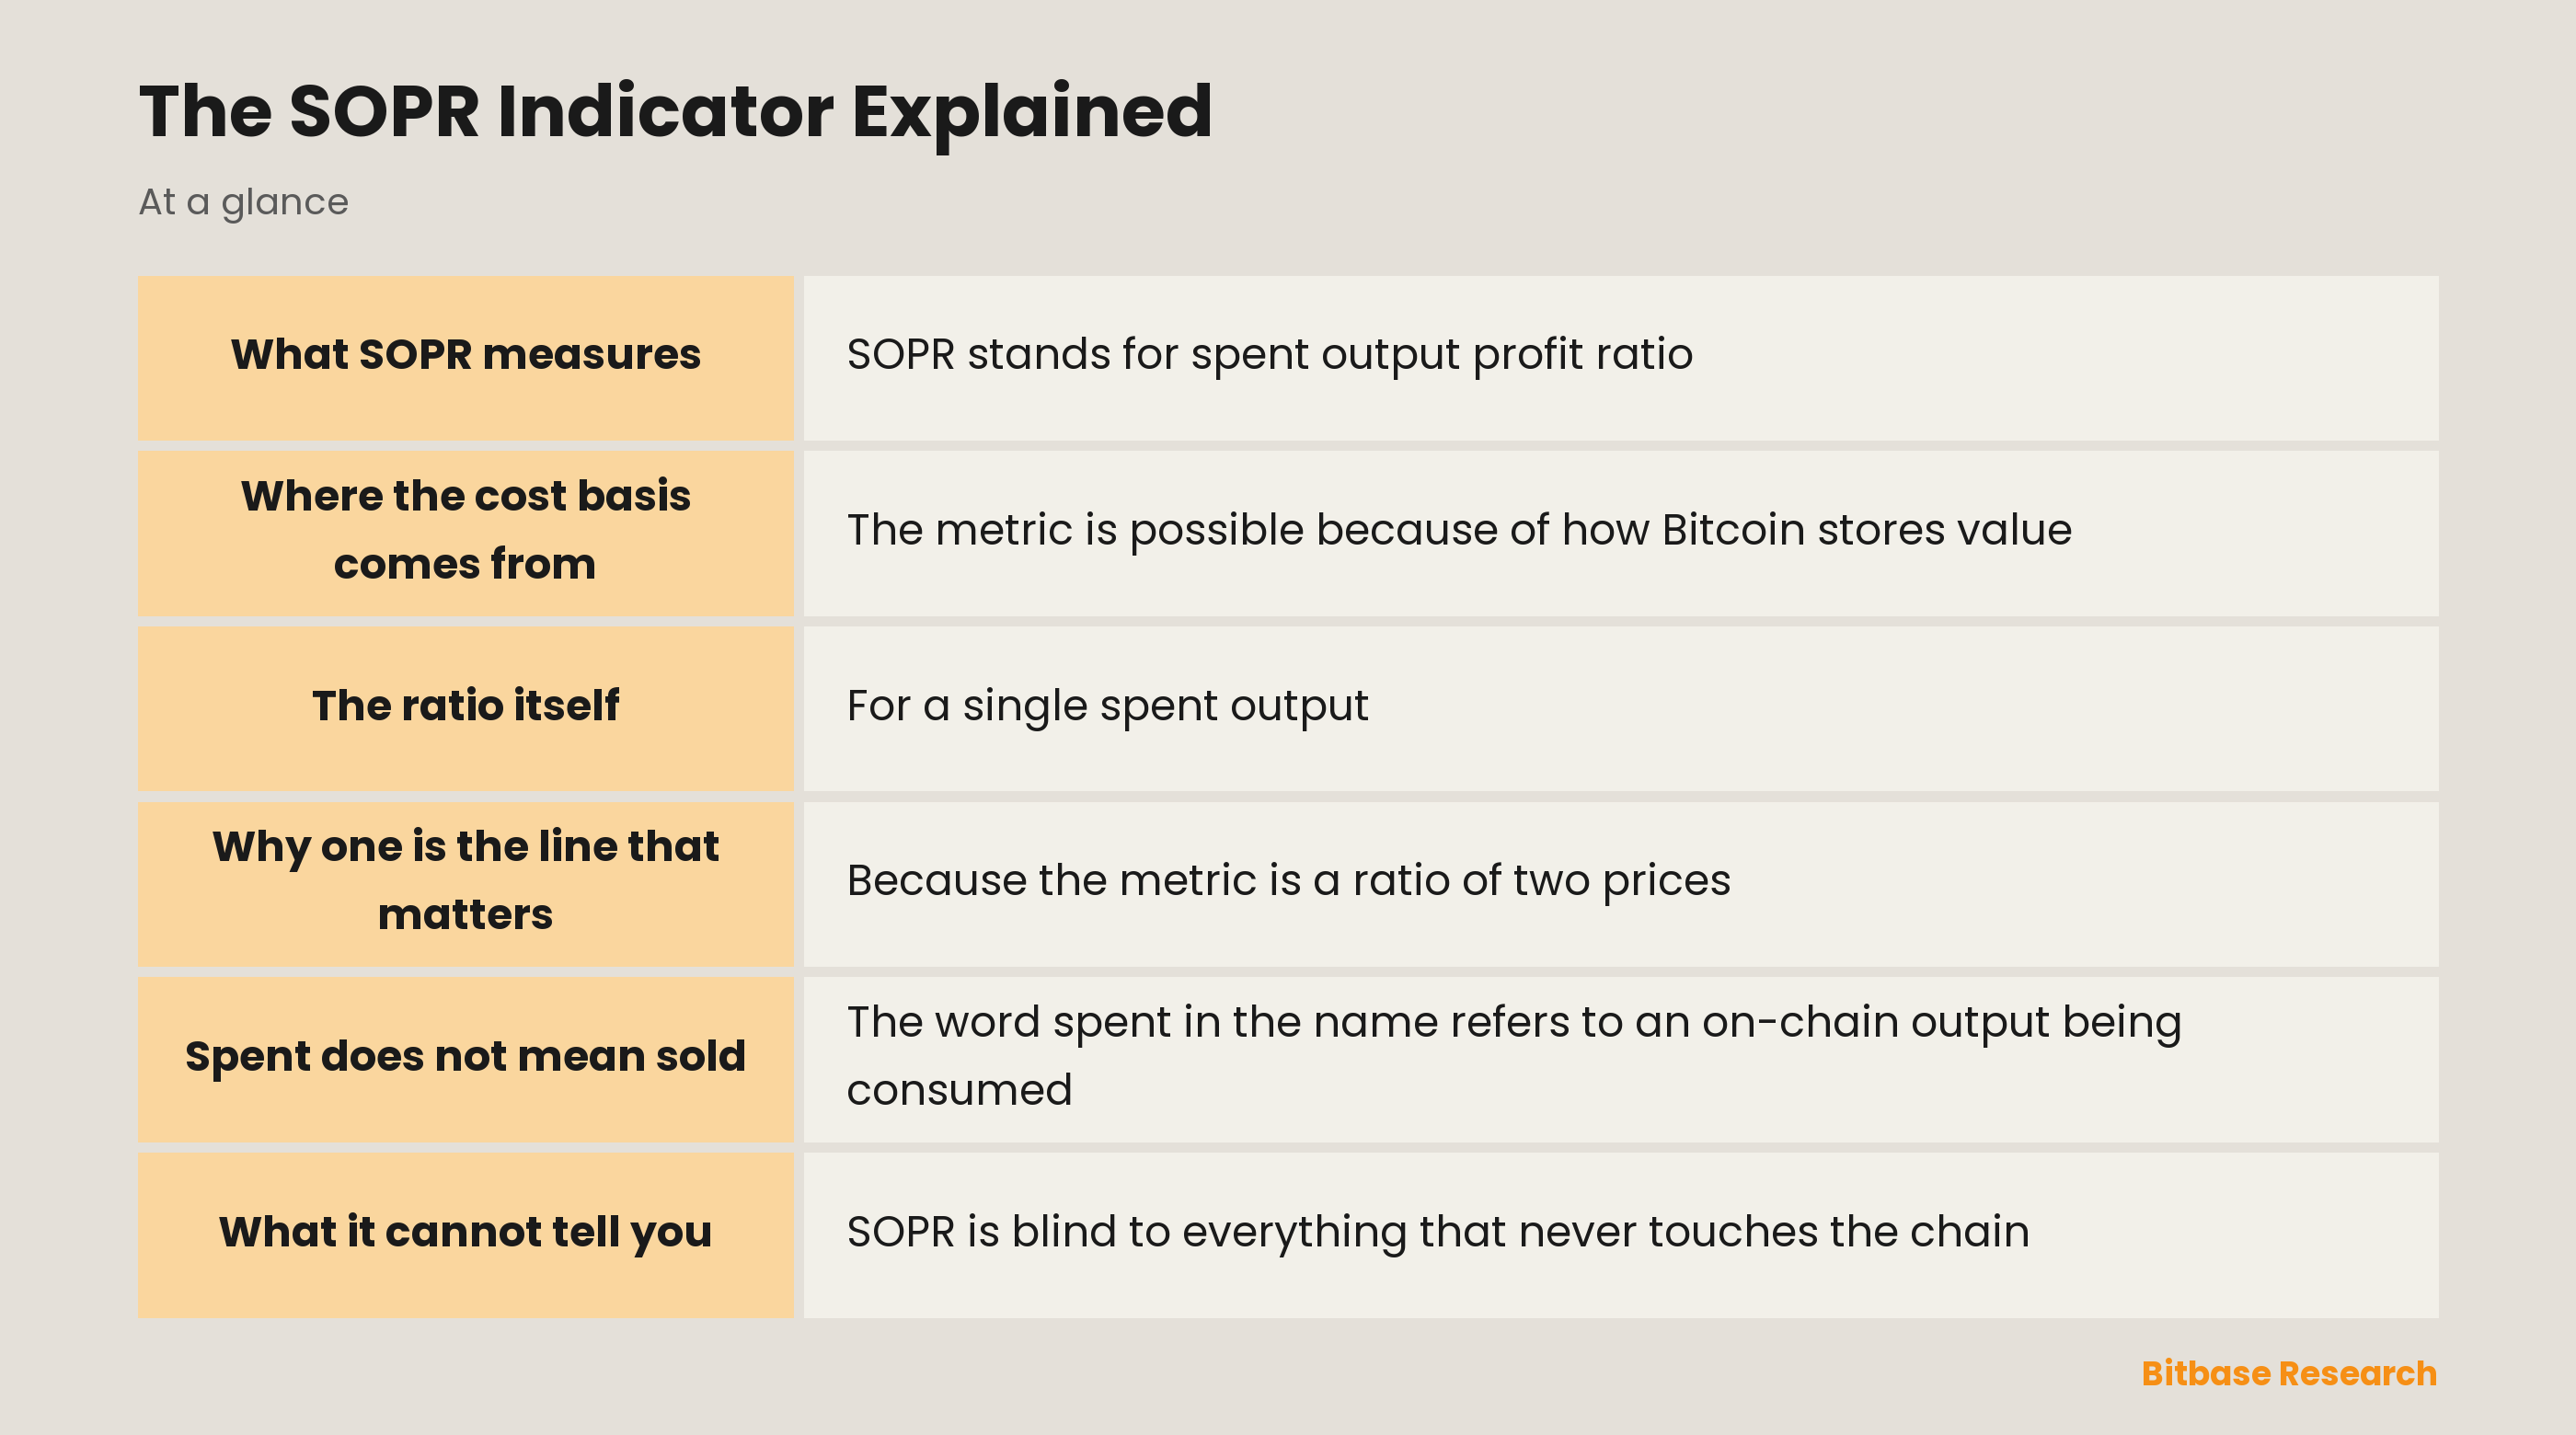
SOPR stands for spent output profit ratio. Glassnode's metric guide describes it as an indicator which reflects the degree of realised profit and loss for all coins moved on-chain. It belongs to the family of on-chain analysis tools that read the ledger directly instead of reading a price chart.
The distinction that makes it useful is between a paper gain and a locked-in one. A price chart tells you what an asset is worth at this moment. SOPR tells you what holders accepted when they actually moved their coins, which puts it much closer to realized profit than to any mark-to-market figure.
Nothing in the metric is a forecast. It is a description of a period that has already closed, compressed into a single ratio.
Where the cost basis comes from
The metric is possible because of how Bitcoin stores value. A balance on that chain is not a number sitting in an account; it is a set of discrete UTXO entries, each one created by an earlier transaction and each one carrying the timestamp of the block that created it.
That timestamp is the whole trick. Look up the price at the moment an output was created and you have an estimate of what its holder paid. Look up the price at the moment it is spent and you have what they got. The chain therefore remembers a cost basis that no order book keeps.
The estimate is not the holder's true cost, and it does not claim to be. An output created by moving coins between two wallets you already control resets the recorded basis without any purchase taking place, and coins bought off-chain never record the purchase at all. The ledger records movement, and movement is only sometimes a trade.
The ratio itself
For a single spent output, SOPR is the value it realized divided by the value it had when it was created. Take an output created when the price was $20,000 and spent when the price was $25,000. The ratio is 1.25, and the realized gain on that output is 25%.
Run the same output against a lower price and the arithmetic simply flips. Spent at $16,000 against the same $20,000 basis, the ratio is 0.8 and the realized loss is 20%.
The aggregate metric applies that calculation to every output spent within a period and combines the results into one figure for the day. That single figure carries a great many separate decisions inside it, which is both why it is readable at a glance and why so much detail disappears into it.
Why one is the line that matters
Because the metric is a ratio of two prices, the value one is exactly the point where the spending price equals the acquisition price. Above one, the coins that moved were on aggregate moved at a gain; below one, at a loss. There is nothing psychological about the line itself. It is arithmetic.
What gets interpreted is the behaviour around it. A market whose SOPR keeps approaching one from above and turning back up is, by definition, a market where the coins changing hands are still being moved at a gain. A market that cannot lift SOPR back above one is one where the coins changing hands are being moved at a loss instead. Those are descriptions of a condition, not entry signals, and the metric offers no view on what happens next.
Spent does not mean sold
The word spent in the name refers to an on-chain output being consumed, not to a sale. Moving coins between your own addresses spends outputs and produces a reading, even though nobody bought or sold anything. Consolidating small outputs into one, rotating to a fresh wallet, and internal transfers inside a custodian all register the same way.
That is a real source of noise, and it is why an adjusted variant exists. Glassnode's guide states that adjusted SOPR filters out all UTXOs with a lifespan of less than an hour from the SOPR metric to better reflect economically meaningful activity on-chain. Coins that arrive and leave within the hour are more readily explained as plumbing than as conviction.
Filtering by lifespan does not remove every internal transfer. A wallet rotation whose outputs sat still for a week survives the filter untouched. Adjusted SOPR narrows the noise band; it does not close it.
The variants side by side
Age is the other axis the metric gets split along. Glassnode defines short-term holder SOPR as a variant that takes into account only spent outputs younger than 155 days, and long-term holder SOPR as one that takes into account only spent outputs older than 155 days. Splitting the population that way lets you ask a sharper question than the headline number answers: which group is the one realizing its position.
| Variant | Which spent outputs it counts | What it is for |
|---|---|---|
| SOPR | All of them | The whole spending population in one number |
| Adjusted SOPR | Those with a lifespan of an hour or more | Removing same-hour internal movement |
| Short-term holder SOPR | Those younger than 155 days | Reading recent buyers on their own |
| Long-term holder SOPR | Those older than 155 days | Reading patient holders on their own |
The four are the same calculation over four different populations, so a divergence between them is informative in a way the headline figure cannot be. One cohort taking losses while another takes gains is invisible once both are averaged into a single ratio.
What it cannot tell you
SOPR is blind to everything that never touches the chain. A trade matched inside an exchange moves no output at all, so a session of heavy spot selling can pass with the metric barely registering it. On-chain metrics describe on-chain events, and trading that never touches the chain is not one of them.
It is also blind to intent. A ratio below one says coins moved at a loss; it does not say whether that was capitulation, a forced liquidation, a tax-driven sale, or an accounting move between two arms of the same business. The number reports the outcome and stops there.
And it is one metric. Read alongside MVRV and supply-in-profit measures, it contributes the realized-outcome dimension those two do not carry. Read alone, it is a single compressed statistic about a market that produces a great many of them.
The bottom line
SOPR compares what coins fetched when they moved against what they were worth when they were created, and reports the answer as a ratio. Above one the coins that moved were in profit, below one they were in loss, and the line between the two is arithmetic rather than sentiment.
Use it for what it is: a measurement of realized outcomes on-chain, cleaned of same-hour plumbing when you reach for the adjusted variant, and split by holder age when you need to know which cohort is acting. Read it as a report on a period that has already closed, not as a prediction of the one that follows. To keep learning the fundamentals, follow more from Bitbase Academy.
Related reading
Other Bitbase articles on this topic:
- Network Congestion Indicators and What Each One Measures
- NFT Wash Trading Warning Signs Explained
- NVT Ratio Explained: Network Value to Transactions
- Advanced Consensus Mechanisms
Disclaimer: This article is educational content from Bitbase Academy, provided for information only. It does not constitute investment, trading, tax, or financial advice. Crypto assets are volatile; assess your own risk. Written as of September 2026; refer to the latest official information.
References
[1] Glassnode Docs, Metric Guides, SOPR docs.glassnode.com
[2] Glassnode Docs, Metric Guides, STH-SOPR docs.glassnode.com
[3] Glassnode Docs, Metric Guides, LTH-SOPR docs.glassnode.com