
Two days can move the same quantity of coins and mean opposite things. On one, traders pass the same units back and forth within hours. On the other, coins that had not been touched since the last cycle change hands. Transfer volume cannot tell those days apart. Token age consumed can, because it counts not only how much moved but how long it had been still.
What a coin day is
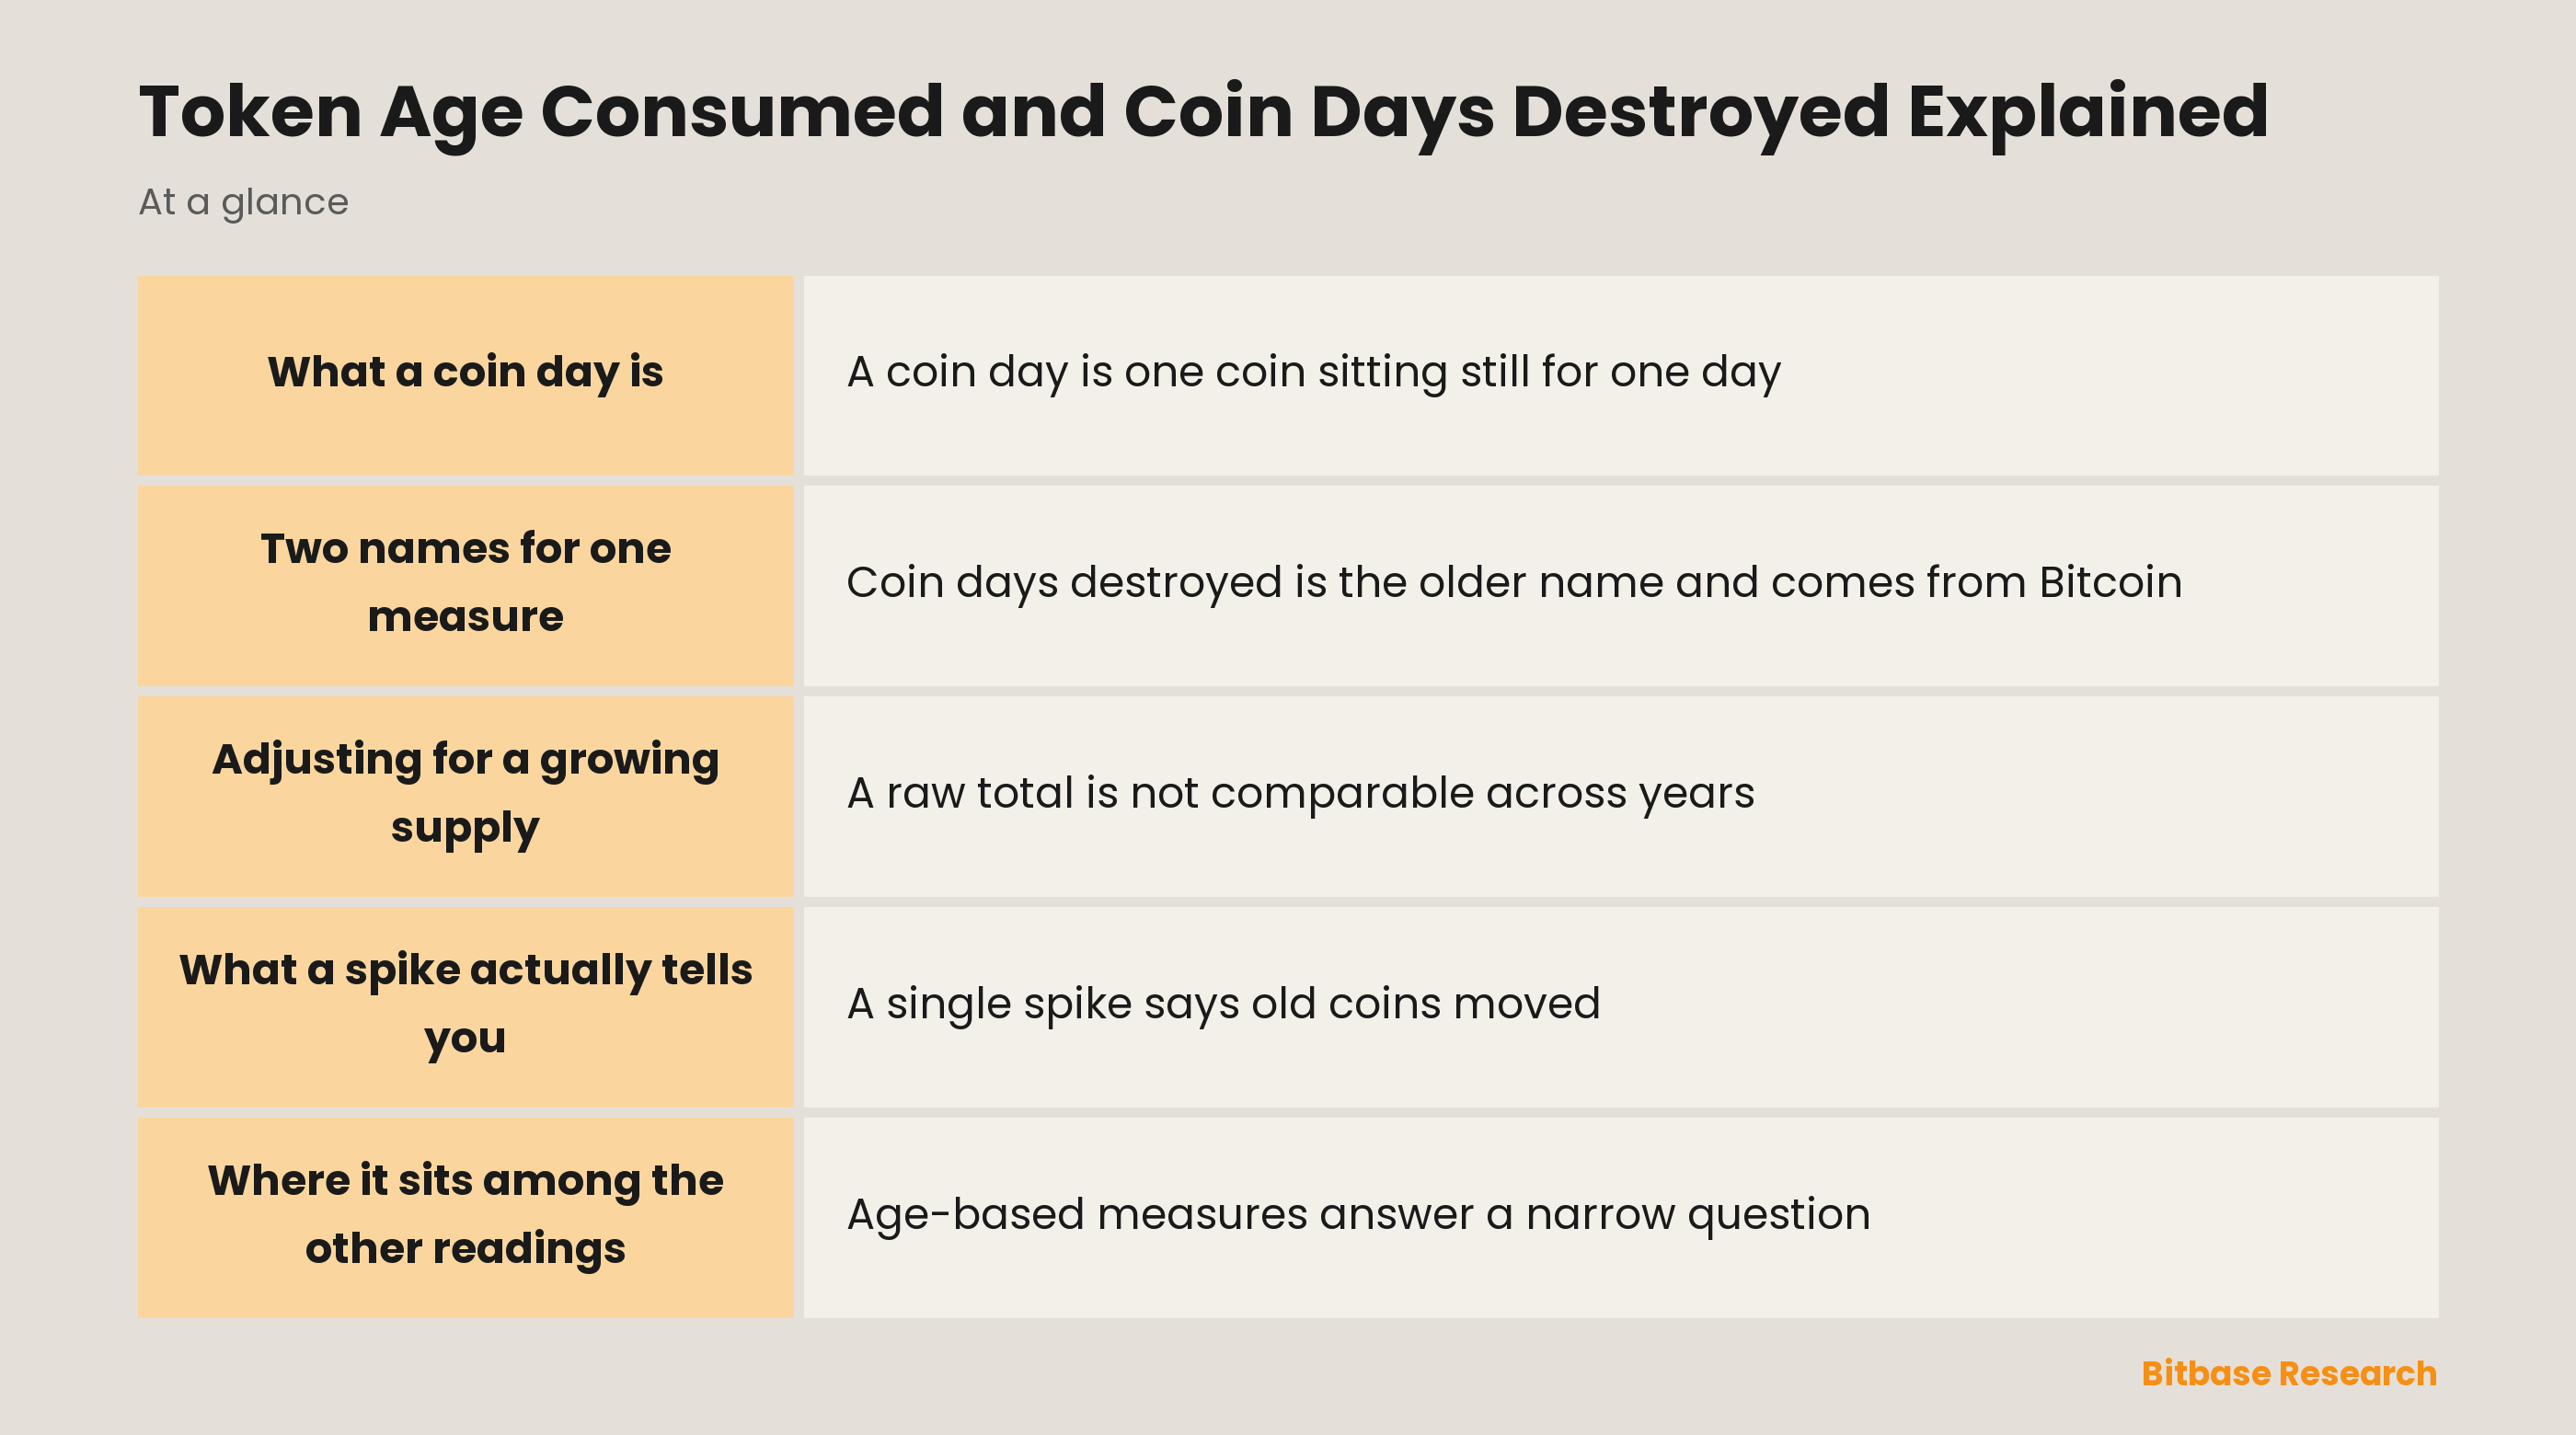
A coin day is one coin sitting still for one day. The counter runs on its own: no transaction creates it, and nothing off the chain affects it. Quantity multiplied by elapsed time is the whole of it.
Spending is what registers. When the coins move, the coin days they had accumulated are set back to zero, and the metric records how many were wiped out. Glassnode's documentation defines coin days destroyed as a measure of economic activity which gives more weight to coins which have not been spent for a long time.
The age being consumed belongs to the coins, not to the address holding them. On a chain that tracks individual pieces of value, each unspent transaction output carries its own clock, so one address can spend a young piece while an old piece beside it keeps ageing. On a chain that tracks account balances there are no separate pieces, and the measure has to be reconstructed from the account's own sending history instead.
Two names for one measure
Coin days destroyed is the older name and comes from Bitcoin, where the unit being aged is a coin. Token age consumed is the same construction applied to any asset: quantity moved, multiplied by time held, summed over a period. Analytics dashboards use one label or the other, and some carry both for the same series.
Neither name implies a direction. Age is consumed whether the coins were sold, moved to safer storage, split among heirs, or shifted between one company's own wallets. The measure sees the movement, and the chain does not record the reason.
The arithmetic, and what it hides
The calculation for a single movement is quantity times days held. Sum that across every movement in a day and you have that day's reading. That is the entire formula, and its simplicity is where the ambiguity comes from.
| Coins moved | Days since they last moved | Coin days destroyed |
|---|---|---|
| 10 BTC | 500 | 5,000 |
| 2,500 BTC | 2 | 5,000 |
Both rows produce 5,000. The first is a small holding waking up after a long sleep; the second is a large block being passed around inside a week. A single day's number cannot separate them, which is why the reading is followed as a series against its own history rather than judged in isolation.
The weighting towards age is deliberate. A holding a fraction of the size can dominate a day's total if it is old enough, and that is the design rather than a defect: it makes the series describe patient holders instead of active traders.
Adjusting for a growing supply
A raw total is not comparable across years. As more coins exist, more coin days accumulate every day, so the baseline for any given level of activity drifts upward on its own. Supply-adjusted coin days destroyed divides the raw figure by the total supply, which removes that drift and lets an old reading be set beside a recent one.
The same reasoning produces the annual view. Coin years destroyed takes a rolling sum of coin days destroyed over the previous year and reads it as a macro indicator of annual economic activity, smoothing away the single-day noise that makes the raw series hard to interpret.
Turning a level into a signal
A level in coin days is not an answer by itself, so the variants that matter are the ones that convert it into a comparison.
| Variant | What it adds | What you read off it |
|---|---|---|
| Coin days destroyed | Nothing; the raw sum | The age destroyed that day |
| Supply-adjusted CDD | Division by total supply | A figure comparable across eras |
| Coin years destroyed | A rolling year of the raw sum | An annual macro view |
| Binary CDD | A comparison to the long-run average | Above average, or not |
Binary coin days destroyed makes that comparison explicit. It is built on the supply-adjusted series and returns one value when the current reading sits above its long-term average and a different one when it sits below, which turns a noisy line into a count of how many days in a window were above average.
That reformulation changes the question being asked. Instead of how much age was consumed today, it asks how many days in a row old coins have been moving, and a run of consecutive above-average days is a different observation from one tall spike.
What a spike actually tells you
A single spike says old coins moved. It does not say who moved them, where they went, or what follows. Movement is the only thing the chain has recorded.
The dull explanations produce the same shape as the dramatic ones. A custodian rotating storage, a holder migrating to new hardware, or an estate being settled all destroy exactly as much age as a sale would. Reading a dormant wallet alert without following the coins to their destination leaves the informative half of the question unanswered.
Aggregation is where the measure earns its keep. Across weeks, a sustained elevation describes what long-term holders as a group are doing, and that group description does not depend on identifying any single large holder. One address is an anecdote; a month of above-average readings is a pattern.
Where it sits among the other readings
Age-based measures answer a narrow question, and they pair with measures answering a different one. The spent output profit ratio compares the price at which coins are spent to the price at which they were acquired, so it describes profit rather than patience. Coin days destroyed says old coins moved; that ratio says whether the coins moving were in profit.
Read together, the two narrow the interpretation. Old coins moving at a large gain looks like long-held positions being realised; old coins moving with no gain looks more like housekeeping. Neither reading is a forecast, and both belong inside the wider frame of on-chain analysis rather than being used alone.
The bottom line
Token age consumed and coin days destroyed are the same measure under two names: quantity moved multiplied by how long it sat still, summed over a period. Its purpose is to weight the movements of patient holders above the churn of active ones, and it does that by construction rather than by any assumption about intent.
Use it as a series, not as a number. Prefer the supply-adjusted form when comparing different years, treat a single spike as a question rather than an answer, and check where the coins went before deciding what the age they destroyed was worth. To keep learning the fundamentals, follow more from Bitbase Academy.
Related reading
Other Bitbase articles on this topic:
- Network Congestion Indicators and What Each One Measures
- NFT Wash Trading Warning Signs Explained
- NVT Ratio Explained: Network Value to Transactions
- The SOPR Indicator Explained
- Blockchain State and Merkle Trees
Disclaimer: This article is educational content from Bitbase Academy, provided for information only. It does not constitute investment, trading, tax, or financial advice. Crypto assets are volatile; assess your own risk. Written as of September 2026; refer to the latest official information.
References
[1] Glassnode Docs, metric guide, CDD (Coin Days Destroyed) docs.glassnode.com
[2] Glassnode Docs, metric guide, Supply-Adjusted CDD docs.glassnode.com
[3] Glassnode Docs, metric guide, CYD (Coin Years Destroyed) docs.glassnode.com
[4] Glassnode Docs, metric guide, Binary CDD docs.glassnode.com